AQUASTAT - FAO's Global Information System on Water and Agriculture
Map quality
Assessment of map quality
A common method to assess the quality of a course scale data-set is to compare it with independent information at selected locations on a more detailed scale in order to draw conclusions with respect to the map quality at these locations and extrapolate it to the general map quality. Here, however, all available data on irrigated areas at appropriate scales were used to compile the map itself and therefore could not be used for a quality assessment. Apart from this, it is very difficult to compare the quantitative information as presented on the map (expressed e.g. as area equipped for irrigation in a 5-minute cell in ha) with point information collected for specific positions by ground-truthing (irrigated or rainfed).
To assess the quality of the Global Map of Irrigation Areas, two indicators were developed that take into account the geospatial information density of the base data:
- Indicator A (IND_A), represents the density of the used subnational irrigation statistics
- Indicator B (INDB), represents the density of the available geospatial records on position and extent of irrigated areas The combination of INDA and INDB is used to describe the overall map quality per country for the data layer of area equipped for irrigation. In contrast, map quality of the data layers on area actually irrigated or on the water sources used for irrigation was assessed based on INDA only, because data were not disaggregated below the level of the subnational statistical units (except for a few countries for which well inventories were available) and therefore IND_B could not be computed.
The density of subnational irrigation statistics can be obtained by calculating the arithmetic mean of the size of the subnational units. However, there are some countries where irrigation is concentrated in some small subnational units while in other very large subnational units of the same country there is no or very little irrigation. To avoid that large subnational units without significant irrigation have a negative impact on indicator A, the size of each subnational statistical unit is weighted by the irrigation density in the subnational unit relative to the irrigation density in the entire country:
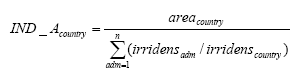
with:
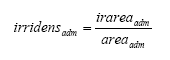
where IND_Acountry is the average weighted size of the subnational units in the specific country (ha), areacountry is the surface area of the country (ha), irridensadm is the irrigation density in subnational unit adm (-), irridenscountry is the irrigation density in region the country (-), n is the number of subnational units in the country, irareaadm is the irrigated area in subnational unit adm (ha) and areaadm is the surface area in subnational unit adm (ha).
INDA equals the average size of all subnational units in a country if the irrigation density is the same all over the country the country. If all irrigated area is concentrated in only one subnational unit, INDA is equal to the size of this subnational unit. INDA is lower than the average size of the subnational units if the irrigation density is higher in small subnational units than in the larger subnational units. Lower values of INDA indicate a better map quality. IND_A was computed for the three data layers (area equipped for irrigation, area actually irrigated, water source on area equipped for irrigation) separately to account for the different resolution of statistical data.
The second indicator (INDB) was developed to give an estimate on the density of geospatial information used to assign area equipped for irrigation to specific cells within the sub-national units. INDB was computed as the fraction of irrigated area that could be assigned to specific grid cells by using geospatial records on the position and extent of known irrigation schemes. Higher values of IND_B indicate a better map quality.
Both indicators were assigned a country mark according to the classification in the following table:
| Mark | Indicator IND_A (ha) | Indicator IND_B (%) |
| Excellent | < 100 000 | 90 - 100 |
| Very good | 100 000 - 250 000 | 70 - 90 |
| Good | 250 000 - 500 000 | 50 - 70 |
| Fair | 500 000 - 1 000 000 | 25 - 50 |
| Poor | 1 000 000 - 3 000 000 | 10 - 25 |
| Very poor | > 3 000 000 | < 10 |
For area equipped for irrigation, a mark for the overall quality was given assuming that the types of information that are reflected by the two indicators can replace each other. The mark for the overall map quality was set to the better of the two marks given according to INDA and INDB. If, for example, the location and extent of almost all irrigation projects in a country is known then subnational statistics are not required in addition to prepare a reliable map . On the other hand, if the size of the subnational statistical units is very small (in an extreme case smaller than the map resolution of 5 arc minutes), the overall quality of the map should also be fine even if there are no geospatial records on the position of irrigation schemes within the sub-national units available. However, in version 5 of the global map of irrigation areas the overall map quality mark “excellent” was only assigned when the better mark according to INDA and INDB was “excellent” and the other mark “very good” or “excellent” as well.
The resulting marks for the quality of the different data layers were downgraded when the used statistical information referred to years before year 2000. In addition, the final marks assigned for the data layer on area equipped for irrigation were downgraded when there were doubts regarding the reliability of the information used for a specific country (e.g. when statistical data and geospatial data were not consistent, when maps were outdated or statistics from different sources were inconsistent).
The percentage of area equipped for irrigation or area actually irrigated assigned to countries with the marks excellent to very poor is shown in the table below. In general, the quality of the layer on area equipped for irrigation was higher than the quality of the other layers because the resolution of the statistics on area equipped for irrigation was higher and in addition, inventories of irrigation projects or irrigation maps were used to assign area equipped for irrigation to specific grid cells. In contrast, area actually irrigated or statistics on the water source for irrigation were often available at country level only so that the mark for the map quality was mainly depending on the size of the country. Therefore these data layers should only be used for analyses at global scale.
Percentage of total irrigated area assigned to regions of different map quality
| Mark | Area equipped for irrigation | Area actually irrigated | Source of water for irrigation |
| Excellent | 2.2 | 2.4 | 4.0 |
| Very good | 17.1 | 202 | 3.5 |
| Good | 73.5 | 38.5 | 31.4 |
| Fair | 4.8 | 1.2 | 9.7 |
| Poor | 2.2 | 4.1 | 7.0 |
| Very poor | 0.1 | 51.6 | 44.5 |
The quality marks for each specific country are listed in the table available for download here. The table specifies the following attributes: Area equipped (ha) = Area equipped for irrigation (ha); Map quality area equipped = Map quality area equipped for irrigation; map quality actually irrigated = Map quality area actually irrigated; map quality source of water = Map quality source of water for irrigation.
A more detailed table listing values for INDA and INDB and reporting reasons for a downgrading of the marks is also available.


