AQUASTAT - FAO's Global Information System on Water and Agriculture
Water resources
AQUASTAT collects statistics on water resources from national sources. These are systematically reviewed to ensure consistency in definitions and consistency between countries sharing the same river basin. A methodology has been developed and rules have been established to compute the different elements of national water resources. The calculation rules are provided in the country water resources sheets, which can be accessed through the country profile page, and which are dynamically generated by the database such that a simple up-to-date product can be provided without requiring database navigation skills. Recently, the methodology used to accommodate transboundary flows has been thoroughly reworked to accommodate some particularly complex river country border crossings. The new system tracks individual river flows across each border, then aggregates all the country to country flows into a global matrix, and then finally these results are aggregated at a national level. This approach allows for a significant increase in data quality as well as providing previously unreleased specific details explaining the transboundary flows.
Important note
The term "Water resources" used in AQUASTAT for total water flow statistics (internal or external, surface water or groundwater, measured or calculated) does not mean that these flows are fully exploitable and available.
Renewable water resources, which are inland waters renewed by the global water cycle, are the main source of water available to humankind. But only a part of these flows is exploitable and effectively usable because:
- the possibilities to mobilize natural water resources vary by country and are unevenly practicable
- the socio-economic criteria of exploitability vary by use and also depend on the physical conditions of accessibility
- part of the natural flow should be reserved for environmental needs of the biosphere and for in-stream uses
- excess flows might cause floods which are not fully controllable by management. For flood risks, please see flood occurrence.
- water flows might not be consistent from month to month, or from year to year, which can make it difficult to adequately capture and utilize them. See interannual variability and seasonal variability.
Because of all these complications, the concept of exploitable or available water resources cannot be the subject of one single or universal definition, although it is the most important part of renewable water resources analyses.
Even though explained in their definitions, it is worthwhile to emphasize here also that the Renewable Water Resources statistics provided in AQUASTAT are long-term annual averages (typically 1961-1990, although specific Period of Reference information is provided where known). This means that for each Renewable Water Resources variable the value is the same in all years. This does not mean that AQUASTAT does not acknowledge climate change, just that the statistics reported here assume a steady state. However, due to climate change renewable water resources patterns will change significantly and AQUASTAT encourages countries to report information on said changing conditions. Based on available data, the only study that AQUASTAT was able to conduct so far to attempt to quantify the effect of climate change refers to rolling averages of annual precipitation (1961-1990, 1971-2000, 1981-2010), which was inconclusive. For the results, a note is being prepared by AQUASTAT and will be soon available here.
Thematic discussion
Methodology changed in March 2015 to include two important changes:
- Water resources variables are no longer 'actual' and 'natural': the distinction between 'natural' (i.e. the theoretical situation which would exist in the absence of humans) and 'actual' (i.e. taking into consideration water that has been withdrawn and is either evaporated or transpired by human economic activities in upstream countries) was eliminated because AQUASTAT did not have sufficient confidence that upstream consumption was well understood.
- Border river flow variables have been modified: shared border rivers are now dealt with under accounted border river flow, which is now part of accounted inflow. This change was introduced mostly because rivers are rarely only border rivers, they enter and/or exit other countries as well. This change will allow all river flow to be dealt with more consistently.
A detailed description of the changes is available in the document below:
AQUASTAT collects statistics on water resources. Data on water resources obtained from national sources are systematically reviewed to ensure consistency in definitions and between countries sharing the same river basin. A methodology has been developed and rules have been established to compute the different elements of a country's water resources. The methodology is described in the article Key Water Resources Statistics in AQUASTAT. The calculation rules are provided in the country "Water resources sheets", which can be accessed through the first drop-down menu above.
With the assistance of Mr. Jean Margat, expert in global water resources assessment, a comparative analysis of available country water resources data is carried out at regular intervals. On that basis, AQUASTAT compiles and updates its best estimates of the main elements of the water resources for each country.
The methodology selected leads to the following variable arrangement:
Click the image to magnify

Note 1: Click on the chart above to magnify. Note 2: The overlap between surface water and groundwater should be deducted from the sum of surface water and groundwater. Note 3: The "Surface water: outflow secured to treaties" is deducted in order to obtain the total external renewable water resources. Note 4: See the glossary for definitions and calculation rules of the variables and terminology used in AQUASTAT.
Water resources updates
For the past few years, AQUASTAT has been improving the way that information on water resources is treated. The methodology being used now introduces several new steps that allow for more meticulous note taking and error checking. At its heart, the change can be explained by tracking individual river points of international significance. Flows at these points are kept in a specific database, along with relevant metadata, comparison with data of the Global Runoff Data Centre (GRDC) data, location information, etc. From there, data can be automatically compiled into a global matrix of international flows. At the matrix level, data and metadata can be better evaluated and compared to national sources. After an acceptable level of quality has been accomplished, the data are transmitted to the Main AQUASTAT Country database, where they can be displayed online in the database results page, as well as in the automatically generated Water Resources Sheet PDF files (see first dropdown at the top of this page).
Visually, the process looks something like this, where black arrows denote the flow of information, and blue arrows denote the iterative quality control steps:
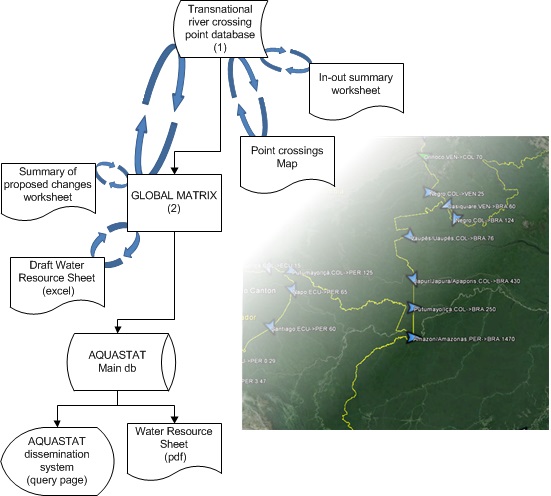
In the above, the Point database and the Matrix are the centerpoints that ultimately drive the entire process. Explaining further:
Point database (1)
Data
- Point-level data for each river crossing of significance
- Nationally reported river-level data if available
- Each data-point has the following information: River name, FROM country and ISO3, TO country and ISO3, Continent, Total flow, Flow submitted to treaties, Flow secured through treaties, Border status, Metadata fields (7), River Order counter, Map Icon direction, Data source, Analysis file, Latitude, Longitude, Nearest GRDC point, if any
Metadata
- Up to a total of 7 individual descriptive metadata per point
Matrix (2)
Data
- Country-to-Country flows
- Total IN and OUT national values
- Nationally reported values
- AQUASTAT database values
- Each of the above is put into a matrix for Total flow, Flow submitted to treaties, Flow secured through treaties, Groundwater
- Also, internal flows are tracked separately (not in matrix format), specifically: precipitation, groundwater, surface water, overlap, and total internal renewable water resources
Metadata
- Aggregated country-to-country metadata
- Nationally aggregated metadata
- Metadata on the database, for comparison purposes
While at a first glance this approach looks unnecessarily complex, it is important to consider that countries report data at varying levels of aggregation, from river-level to full national-level values. More than any other variables, having a system that allows AQUASTAT to keep all data and notes in the correct "box" ultimately results in increased data quality, more metadata being revealed, and ultimately reduces the workload to process new data.
In addition, more substantial changes to the way water resources are reported by AQUASTAT are currently under discussion with experts. When these discussions have concluded, a report documenting the rationale will be released.
Selected publications
A list of all publications is available on the Publications page. A non-exhaustive selection of some publications more specifically related to water resources is given below:
- Renewable water resources assessment - 2015 methodology review
- Proceedings of expert workshop in Latin America
- Dams and agriculture in Africa
- Key water resources statistics in AQUASTAT
- Review of world water resources by country
- Water resources of the Near East region: a review
- Water resources of African countries: a review


