AQUASTAT - FAO's Global Information System on Water and Agriculture
Water use
In AQUASTAT, three types of water withdrawals are distinguished: self-abstracted agricultural, self-abstracted industrial and municipal (including domestic) water withdrawal. A fourth type of anthropogenic water use is the water that evaporates from artificial lakes or reservoirs associated with dams. Information on evaporation from artificial lakes is being processed to also become available in the AQUASTAT database.
For Africa, Asia, Latin America and the Caribbean, AQUASTAT obtains water withdrawal values from national ministries or other governmental agencies, although some data gaps are filled from other UN agencies. For Europe and for Northern America, Japan, Australia and New Zealand, Eurostat and OECD are valuable additional sources of information, and are also used to fill data gaps.
To further fill data gaps, AQUASTAT has done some limited modeling for certain unavailable water withdrawal data using GIS, water balance models and regression analysis.
Information on water use by source involves surface water, groundwater and direct use of non-conventional sources of water, i.e. municipal wastewater and agricultural drainage water for irrigation purposes and desalinated water.
Thematic discussion
The amount of precipitation falling on land is almost 110 000 km3 per year. About 56 percent of this amount is evapotranspired by forests and natural landscapes and 5 percent by rainfed agriculture. The remaining 39 percent or 43 000 km3 per year is converted to surface runoff (feeding rivers and lakes) and groundwater (feeding aquifers). These are called renewable freshwater resources. Part of this water is being removed from these rivers or aquifers by installing infrastructure. This removal of water is called water withdrawal. Most of the withdrawn water is returned to the environment some period of time later, after it has been used. The quality of the returned water may be less than the quality when it was originally removed.
In AQUASTAT, three types of water withdrawal are distinguished: agricultural (including irrigation, livestock and aquaculture), municipal (including domestic) and industrial water withdrawal. A fourth type of anthropogenic water use is the water that evaporates from artificial lakes or reservoirs associated with dams. Information on evaporation from artificial lakes will be available in the AQUASTAT database in the near future.
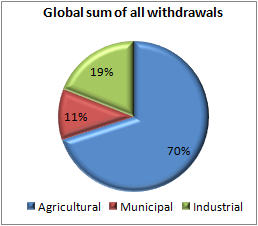
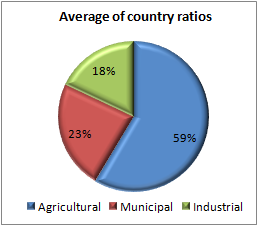
At global level, the withdrawal ratios are 69 percent agricultural, 12 percent municipal and 19 percent industrial. These numbers, however, are biased strongly by the few countries which have very high water withdrawals. Averaging the ratios of each individual country, we find that "for any given country" these ratios are 59, 23 and 18 percent respectively.
 |
 |
The water withdrawal ratios also vary much between regions, going from 91, 7 and 2 percent for agricultural, municipal and industrial water withdrawal respectively in South Asia to 5, 23 and 73 percent respectively in Western Europe. For more details about water withdrawal by region, please see this table.
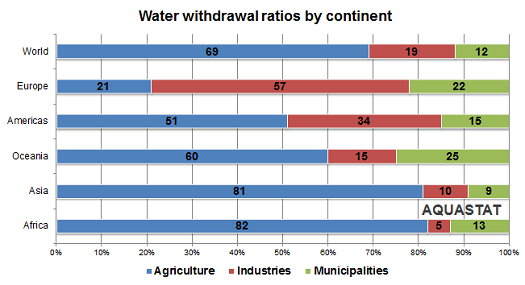
The importance of agricultural water withdrawal is highly dependent on both climate and the place of agriculture in the economy. The chart below shows the water withdrawal ratios by continent, where the agricultural part varies from more than 80 percent in Africa and Asia to just over 20 percent in Europe.
Click the chart to magnify
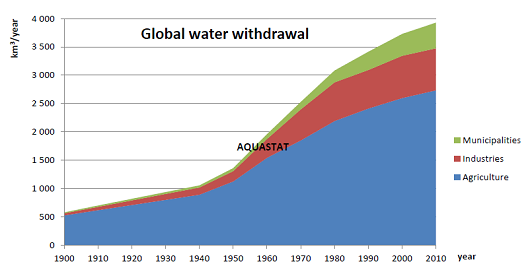
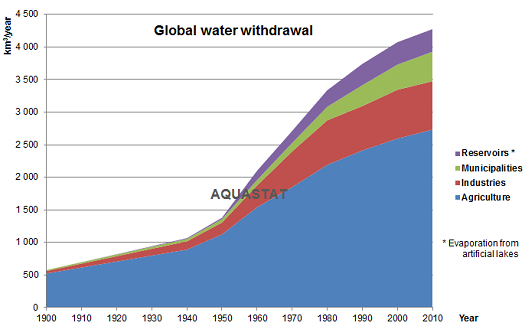
The chart below shows global water withdrawal over time by by the three major sectors: agriculture (including irrigation, livestock watering and cleaning, aquaculture), industries, municipalities.
Click the chart to magnify
The chart below shows global water withdrawal over time with in addition to the water withdrawal by the three major sectors – agriculture (including irrigation, livestock watering and cleaning, aquaculture), industries, municipalities – the evaporation from reservoirs, which are artificial lakes created when a dam is built and where water evaporates from their surface area. While this is not a water withdrawal per se, it should be considered as an anthropogenic consumptive water use, since this evaporation would not take place without the human intervention of building a dam to store freshwater resources for different purposes, such as for withdrawal by one of the above sectors, for generating electricity (hydropower), etc.
Click the chart to magnify
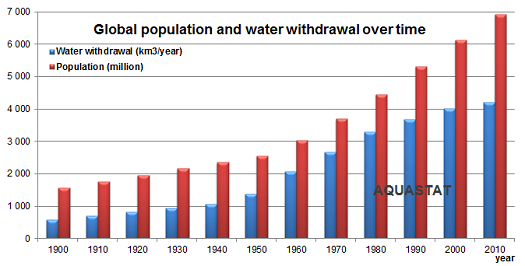
The graphs below combine global water withdrawal and world population over time. World population increased 4.4 times over the last century while water withdrawal increased 7.3 times over the same period. Thus, global water withdrawal increased 1.7 times faster than world population. However, it can also be seen from the graph that, while world population is still growing exponentially, increase in water withdrawal has slowed down over the last decades.
Differently said, between 1900 and 2010, world population increased 340 percent or 1.3 percent per year, varying from 1 percent per year during the period 1900-1940 to almost 1.6 percent per year during the period 1970-2010. Between 1900 and 2010, water withdrawal increased 630 percent or 1.8 percent per year, varying from 1.5 percent per year during the period 1900-1940 to 1.1 percent per year during the period 1970-2010. The largest increase in water withdrawal took place between 1950 and 1960, 4.2 percent per year, while it was only just 0.5 percent per year during the period 2000-2010.
Click the chart to magnify
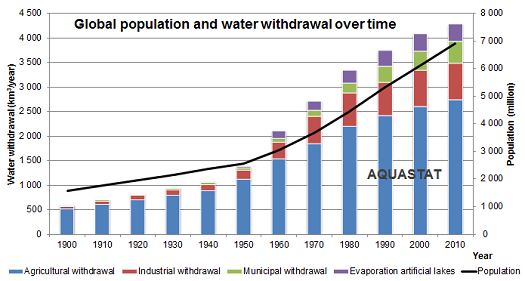
Another way of presentation, using different axes for population and water withdrawal, and also showing water withdrawal by sector, is given in the graph below.
Click the chart to magnify
Selected publications
A list of all publications is available on the Publications page. A non-exhaustive selection of some publications more specifically related to water uses is given below:
- Monitoring agricultural water use at country level: experiences of a pilot project in Benin and Ethiopia (Annex 1, Annex 2, Annex 3, Annex 4)
- Proceedings of expert workshop in Latin America
- Cooling water for energy generation and its impact on national-level water statistics
- Municipal and industrial water withdrawal modelling for the years 2000 and 2005 using statistical methods
- Disambiguation of waters statistics


