FAO Regional Office for Europe and Central Asia
In their pursuit to ensure an equitable and sustainable future, governments can rely on FAO expertise in food and agriculture. Responding to the needs of Europe and Central Asia, the Organization is offering support in many specific areas. Find out more
Highlights


Regional Priority Programmes

Regional Priority Programme
Facilitating inclusive rural transformation for enhanced livelihoods and sustainable development

Regional Priority Programme
Shaping food environments and markets for healthy diets and sustainable agrifood systems

Regional Priority Programme
Advancing natural resources management, environmental protection and climate resilience
Recent and upcoming events
8/7
2026
ECA44/ExCom3 - Meeting of the Executive Committee of the ECA
Virtual Event, 08/07/2026
The upcoming meeting of the Executive Committee of the European Commission on Agriculture is scheduled for 8 July 2026. It will focus on the outcomes of the 35th Session of the Regional Conference for Europe (ERC), hosted by the Government of Tajikistan from 11 to 15 May 2026. The Committee will also discuss the date of the 45th Session of the ECA in 2027 and the process for identifying the mai...
30/6
2026
1/7
2026
Coordination Meeting of the One Health Committee under the Coordination Council on Public Health of the Cabinet of Ministers of the Kyrgyz Republic
Bishkek (Kyrgyzstan), 30/06/2026 - 01/07/2026
The Coordination Meeting of the One Health Committee under the Coordination Council on Public Health of the Cabinet of Ministers of the Kyrgyz Republic aims to strengthen intersectoral collaboration and define concrete steps for the further institutionalization and implementation of the One Health approach in the country.
Featured publications

From vulnerability to resilience: Guidelines for assessing climate change impacts in agricultural heritage systems
2026
This publication presents an eight-step guide to assess vulnerability and resilience to climate change impacts in Globally Important Agricultural Heritage Systems and in agricultural systems with similar characteristics. With a particular focus on Europe and Central Asia, the guide supports practitioners in designing and implementing context-specific climate vulnerability assessments that strengthen adaptive capacity and promote dynamic conservation.

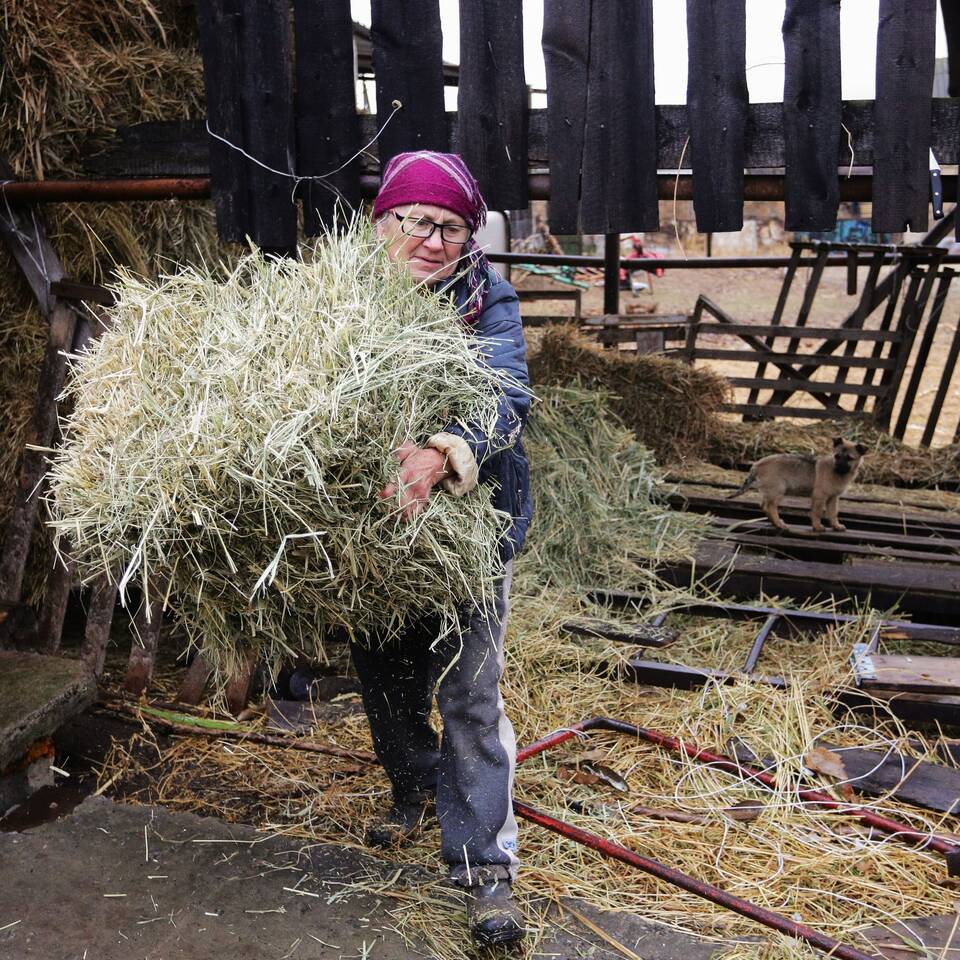
Ukraine: Food security and agricultural livelihoods assessment, July 2025
2026
This report analyses the state of food security and agricultural resilience in Ukraine’s war-affected regions in 2025. It examines how ongoing hostilities, economic disruption and damage to agricultural assets are affecting household livelihoods, production capacity and access to food.
In depth


.jpg?sfvrsn=c2b9e520_3)


Multimedia


Contact
20 Kalman Imre utca
H-1054 Budapest
Hungary
Tel: +36 1 4612000
Fax: +36 1 3517029
E-mail:
FAO-RO-Europe@fao.org