AQUASTAT - FAO's Global Information System on Water and Agriculture
Help/FAQ
The purpose of this page is to resolve issues or questions you may be experiencing. This page is work in progress, and will continue to grow as per user feedback. If there is an item that you feel should be added to this page, or if you have questions not addressed by this page, please do email us.
Index
1. How can I improve the layout of data on the results screen so that it better suits my needs?
2. What year is selected in each "period"? Why are periods reported and not years?
3. Why is the data on Precipitation and Renewable Water Resources the same for every period?
4. What does "Latest value only" mean?
Topics
1. How can I improve the layout of data on the results screen so that it better suits my needs?
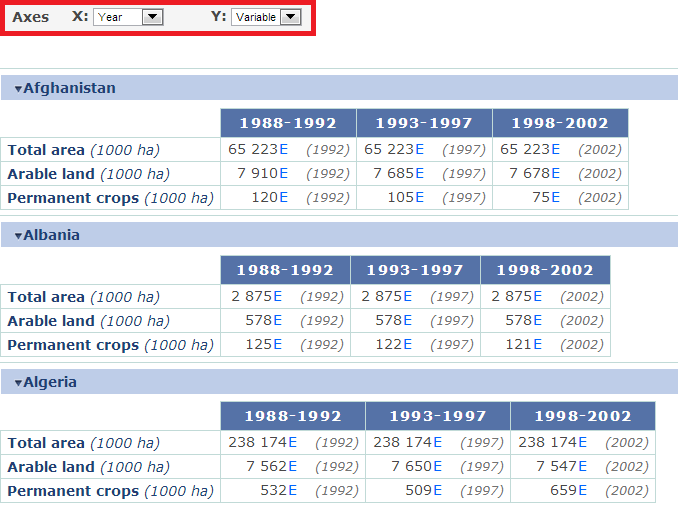
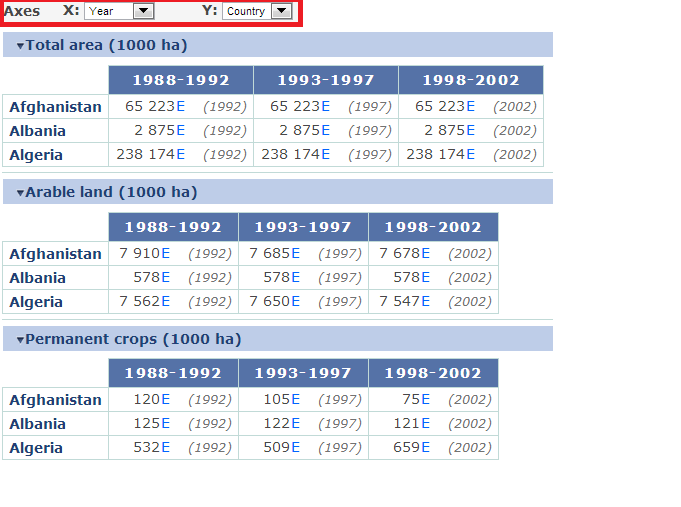
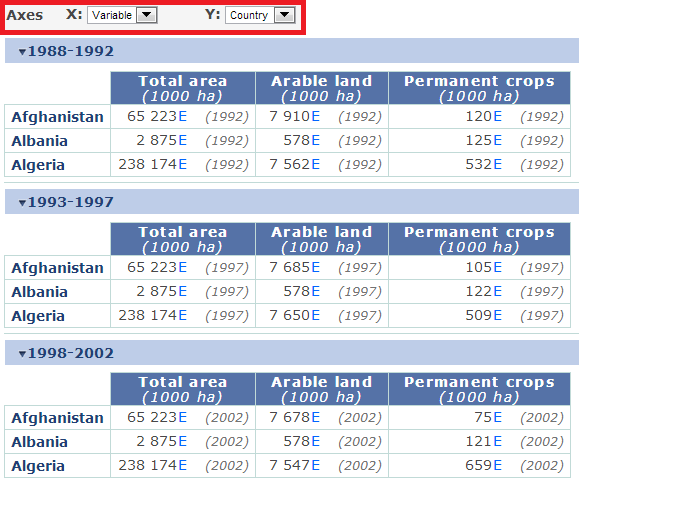
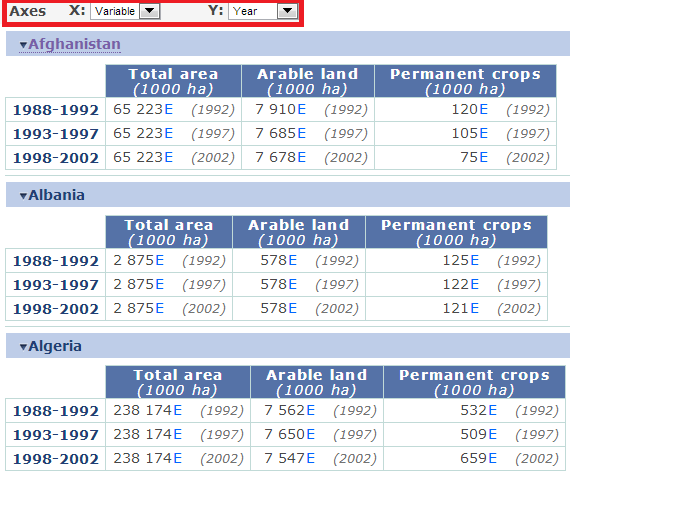
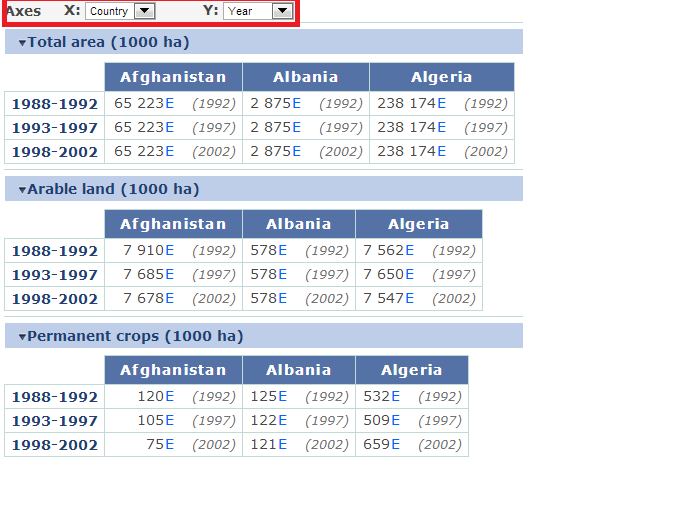
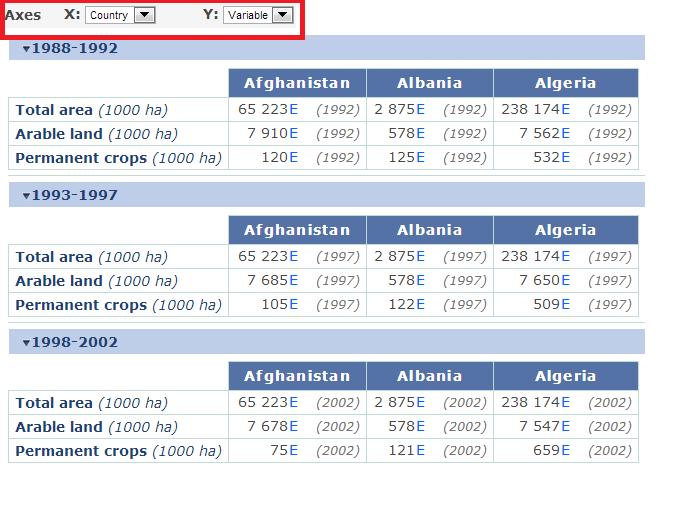
You can control the way in which results are presented on the results page by modifying the AXES under "Options" at the bottom left of the Query page. For example, if you have one variable and many countries and more periods, then it might be best to put countries on the Y-axis and periods on the X-axis.
The following images demonstrate the different results obtained using different axes settings:
2. What year is selected in each "period"? Why are periods reported and not years?
The latest value that has data of every 5 year period is shown, NOT the average value of that 5 year period. For example, if data are available for the year 2004 and for the year 2008, then the period 2003-2007 value in the AQUASTAT core database corresponds to an imputed (linear interpolation) value for the year 2007. Periods are reported as a legacy of the former AQUASTAT working system relying on the data that did not exist every year, but yearly data and calculations are available internally and will be externally display as soon as possible.
3. Why is the data on Precipitation and Renewable Water Resources the same for every period?
The values for precipitation and renewable water resources are "stable", which means they are annual averages of the 1961-1990 period of reference unless otherwise specified. They are NOT yearly values. Average periods of reference are used to attempt to solve the "signal in noise" problem plaguing all weather data without requiring complex statistical analysis to every data set. AQUASTAT does not endorse the adequacy of a 30 year period of reference, but uses the 1961-1990 period of reference in order to provide internationally comparable information. AQUASTAT endorses a "rolling" period of reference approach (to take 30-year averages every 10 years, so 1961-1990, 1971-2000, 1981-2010, etc) in order to attempt to quantify, or at least visualize the effects of climate change, although it is recognized that the 30-year period of reference is probably not significant in arid areas.
At present, the only indication of changing precipitation or renewable water resources offered by AQUASTAT is the National Rainfall Index (NRI), an indicator developed by FAO, which represents the quality of the crop growing season. The NRI yearly results take into consideration the precipitation that year, the average precipitation over the period 1986-2000, the seasonality of the main crop-growing season (distinguishing between northern and southern hemispheres), and what areas of the country are wetter. The median of each five year period is provided. Note: due to methodological differences, this variable is not comparable to average precipitation. For more information, please see the NRI section of FAO's "Climate Impact on Agriculture" web page.
4. What does "Latest value only" mean?
Analyses involving many variables or many countries frequently are complicated to visualize, especially when considering different time periods with different data offerings. For these scenarios, the AQUASTAT database allows for the latest data value to be provided for each data series, eliminating the time dimension. The year of the displayed data is provided in parenthesis in this latest value view. In order to enable this feature, please checkmark the following box in the data query page:
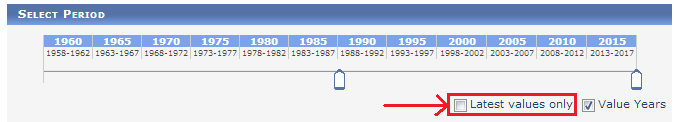
Make sure your data is structured either with Variables on X-axis and Countries on Y-axis or vice versa (i.e. don't put Year as one of the axes) (see topic 1).
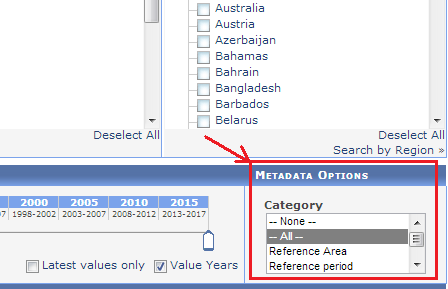
5. Why are some cells green?
In the data results screen, cells that are displayed with a green background have descriptive metadata attached to that particular data-point. Please click on the cell to view the relevant metadata.