AQUASTAT - FAO's Global Information System on Water and Agriculture
China
The irrigated areas by province (for mainland China) and by county (both for mainland China and for Taiwan Province of China) can be downloaded as China irrigation areas in PDF or China irrigation areas in Excel (three sheets).
China, excluding the province of Taiwan
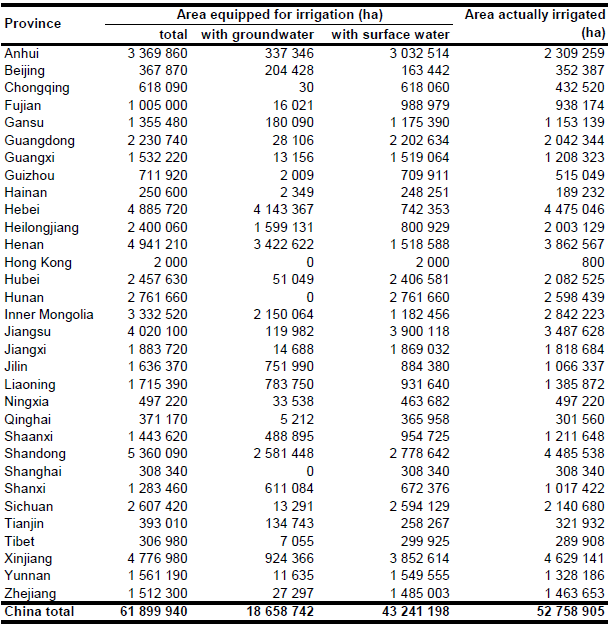
Area equipped for irrigation reported for 31 provinces adds up to 61 897 940 ha [CN01]. The figures refer to year 2005 and are limited to the provinces in China mainland. The farm area for China Hong Kong SAR was reported to be 6 960 ha in the 2000 cropping season, while the area actually cropped was 2 710 ha [CN02]. Based on these statistics, the irrigated area in China Hong Kong SAR was estimated to be 2 000 ha, resulting in a total AEI of 61 899 940 ha.
There are large uncertainties regarding the extent of irrigated land in China. Inventories based on remote sensing reported a much larger extent of areas under irrigation compared to the census based statistics. For example, irrigated area has been estimated at 78 million ha for the 1992–93 cropping season [CN03], while irrigation statistics derived from the data base of the agricultural census 1990 [CN04] reported a total AEI of 46 million ha. In addition, irrigated areas were digitized from a 1:1 000 000 land-use atlas [CN05]. The atlas was published in 1990 and is based on satellite images and large-scale aerial photographs taken in the 1980s. Irrigated areas and paddy rice areas derived from the land-use map totalled about 68 million ha. The use of different definitions for irrigated land may explain parts of the difference. Statistical yearbooks like the annual yearbooks of the National Bureau of Statistical [CN06] report for example the so called “effective irrigation area” which refers to irrigated area of annual crops [CN07]. In year 2005 the effective irrigation area was 56 562 360 ha in thus about 11 percent smaller than total area equipped for irrigation, while only 47 968 730 ha of the “effective irrigation area” was irrigated in year 2005.
In order to estimate irrigated area per county in year 2005, four inventories were combined. AEI per province was assumed to be as given in [CN01]. The downscaling to county values was achieved by combining the census results for the county level in 1990 [CN04] and the irrigated area per county as taken from the land-use atlas [CN05]. First, the upper and lower limits of irrigated area per province were computed by calculating the sum of minimum and maximum irrigated areas per county as taken from the two inventories (Table 1).

If the so computed maximum extent was larger than total cropland derived from the National Land Cover Database 2000 (NLCD2000) [CN08], the maximum was reduced to total cropland extent in the NLCD2000. It was then assumed that the irrigated area per county was at least as high as the minimum of irrigated area taken from the two inventories plus the difference from the maximum value scaled by a coefficient s. The coefficient s was constant for all counties within the same province and was chosen so that the sum of the irrigated area in all counties equalled the irrigated area per province. It was possible to use this method for 23 of the 30 provinces in China mainland. In the provinces Hebei, Heilongjiang, Inner Mongolia, Jilin, Liaoning, and Tibet the computed upper limit of irrigated area was lower than the AEI reported for 2005. This indicates a considerable increase in irrigated areas in these provinces between 1990 and 2005. Irrigated area per county was computed here as a maximum of the two inventories plus the rainfed agricultural land scaled by a coefficient so that the sum of the computed irrigated areas per county equalled the irrigated area per province in 2005. The irrigated areas by province are visible in the table below. The irrigated areas both by province and by county can be downloaded as China irrigation areas in PDF or China irrigation areas in Excel (two sheets).
The irrigated areas were derived from the land-use atlas published in 1990 (scale: 1:1 000 000). The atlas was available in a printed hardcover version [CN05] and in a digital version [CN09]. The digital version had a lower resolution and consisted of fewer classes than the printed version. Therefore, fields classified as irrigated or as paddy were digitized from the printed atlas version for 754 counties, covering about 67 percent of the country area. The digital version of the map was used for the other counties, which are mainly located in southeast China and usually very small. It was assumed that all the paddy-fields were irrigated. Additionally, irrigated area was assigned to pixels classified as paddy land in the NLCD2000. If the irrigated land identified that way was still smaller than total AEI, the difference from the irrigated area was distributed to rainfed agriculture fields derived from the NLCD2000.
Area equipped for irrigation with groundwater and area actually irrigated per province in year 2005 was extracted from [CH01]. It was thereby assumed that the AEI irrigated with groundwater is similar to the area covered by tube wells. Total area equipped for irrigation is 18 658 742 ha (30 percent of total AEI) while area actually irrigated in year 2005 was 52 758 905 ha (85 percent of AEI).
References
[CN01]: Ministry of Water Resources. 2006. China statistics on water resources 2005. Ministry of Water Resources (MWR), Beijing, PR of China.
[CN02]: Agriculture, Fisheries and Conservation Department. 2002. Department annual report 2001/02. http://www.afcd.gov.hk, 21/11/2004.
[CN03]: Frolking, S., Xianming, X., Yahui, Z., Salas, W., Li, C. 1999. Agricultural land-use in China: a comparison of area estimates from ground-based census and satellite-borne remote sensing. Glob. Ecol. Biogeog., 8: 407-416.
[CN04]: Skinner, G.W. 1997. China county-level data on population (census) and agriculture, keyed to 1:1M GIS map. Center for International Earth Science Information Network (CIESIN), http://sedac.ciesin.columbia.edu, 20/11/2004.
[CN05]: Wu, C. 1990. Land-use map of China (1:1 000 000 scale). Beijing, Science Press.
[CN06]: National Bureau of Statistics. 2006. China Statistical Yearbook 2006. National Bureau of Statistics, http://www.stats.gov.cn/tjsj/ndsj/2006/indexeh.htm, 20/08/2010.
[CN07]: FAO. 2011. AQUASTAT country profile of China, version 2010. FAO, Rome, Italy.
[CN08]: Liu, J., Tian, H., Liu, M., Zhuang, D., Melillo, J.M., Zhang, Z. 2005. China’s changing landscape during the 1990s: Large-scale land transformations estimated with satellite data. Geophysical Research Letters 32, L02405.
[CN09]: Chinese Academy of Sciences. 1994. Digital land-cover map of China. Beijing, Institute of Remote Sensing Applications.
Taiwan Province of China
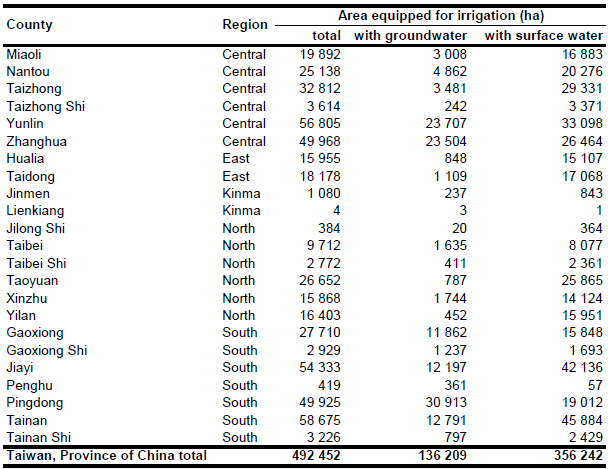
Total cultivated area of Taiwan, Province of China, decreased from 667 602 ha in 1990 to 656 676 ha in 1995 [TW01], 627 160 ha in 2000 [TW02], and 597 438 ha in 2005 [TW03]. In contrast, the irrigated area increased from 510 500 ha in 1990 to 525 528 ha in 1995 [TW04], but decreased then to 492 452 ha in 2005 [TW03]. Area equipped for irrigation was derived for each county and city from the report of the agriculture, forestry, fishery and husbandry census 2005 [TW03]. The irrigated area per county estimated that way is visible in the table below and also can be downloaded as China irrigation areas in PDF (page 44) or China irrigation areas in Excel (third sheet).
Irrigated area was assigned to pixels classified as paddy land (priority 7) or non-paddy cropland (priority 6) in the National Land Cover Database of China for the year 2000 (NLCD2000) [TW05] and to irrigated areas shown on a land cover atlas related to year 1990 [TW06].
Area irrigated from groundwater and surface water sources was derived for each county and city from the report of the agriculture, forestry, fishery and husbandry census 2005 [TW03]. It was assumed that the area supplied by “irrigation associations”, “rivers and ponds” and “other sources” represented area irrigated with surface water while area served with “groundwater” represented area irrigated with groundwater. Total area irrigated with groundwater was 136 209 ha. Area actually irrigated was assumed to be similar to area equipped for irrigation.
References
[TW01]: Directorate-General of Budget, Accounting and Statistics. 1997. 1995 Agricultural, forestry, fishery and husbandry survey, p. 24. General Report. Taipei, Taiwan Province of China, http://www.dgbas.gov.tw, 28/09/2004.
[TW02]: Directorate-General of Budget, Accounting and Statistics. 2002. 2000 Agricultural, forestry, fishery and husbandry survey, p. 29. General Report. Taipei, Taiwan Province of China, http://www.dgbas.gov.tw, 28/09/2004.
[TW03]: Directorate-General of Budget, Accounting and Statistics. 2007. Agriculture, forestry, fishery and husbandry census 2005 – statistical tables. Directorate General of Budget, Accounting and Statistics, Statistical Bureau, Taipei City, Taiwan, http://eng.stat.gov.tw/ct.asp?xItem=18685&ctNode=1634, 28/08/2009.
[TW04]: Directorate-General of Budget, Accounting and Statistics. 1997. 1995 Agricultural, forestry, fishery and husbandry survey, Table 16. General Report. Taipei, Taiwan Province of China, http://www.dgbas.gov.tw, 28/09/2004.
[TW05]: Liu, J., Tian, H., Liu, M., Zhuang, D., Melillo, J.M., Zhang, Z. 2005. China’s changing landscape during the 1990s: Large-scale land transformations estimated with satellite data. Geophysical Research Letters 32, L02405.
[TW06]: Wu, C. 1990. 1:1,000 000 land use map of China. Beijing.
Macao
The total land area of Macao is about 2 680 ha of which 577 ha are classified as green area. The green area contains about 67 ha of gardens, parks and squares, 3 ha are classified as nurseries [MO01]. However, no information was available on agricultural land use and irrigation. Therefore, it was assumed that there is no irrigated area in Macao.
References
[MO01]: Statistics and Census Service. 2004. Environment statistics 2002 (available at http://www.dsec.gov.mo).


