Plateforme de connaissances sur l'agriculture familiale

Smallholders dataportrait

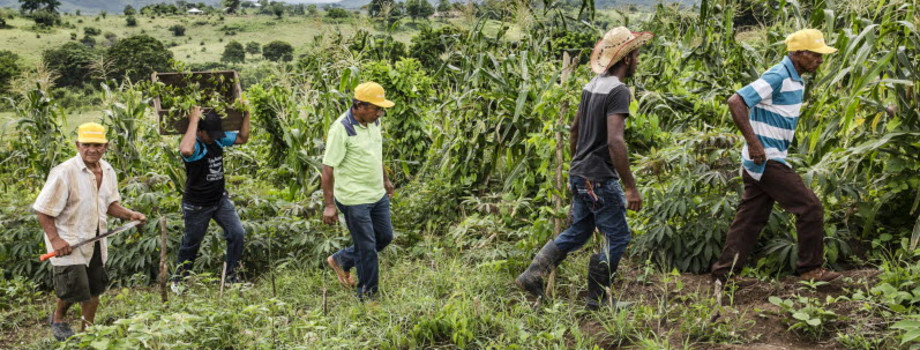
The smallholder farmers' dataportrait is a comprehensive, systematic and standardized data set on the profile of smallholder farmers across the world. It generates an image on how small family farmers in developing and emerging countries live their lives. It is about putting in numbers, the constraints they face, and the choices they make so that policies can be informed by evidence to meet the challenge of agricultural development. Currently, the data portrait provides information for nineteen countries.

Smallholders Data Portrait: Methodology and Data Description

A data portrait of smallholder farmers: An introduction to a dataset on small-scale agriculture

Hectare weighted median
Smaller farm Other farm Nationally
Sub-Saharan Africa Ethiopia, 2012 Sample (% of households reporting inputs)
70 79 72
Sub-Saharan Africa Ethiopia, 2012 % of households buying ag. inputs through informal channels
99 99 99
Sub-Saharan Africa Ethiopia, 2012 % of households buying ag. inputs through formal channels
1 1 1
Sub-Saharan Africa Ethiopia, 2012 % of households buying ag. inputs in the local markets
Sub-Saharan Africa Ethiopia, 2012 % of households buying ag. Inputs in the other markets
Sub-Saharan Africa Ethiopia, 2012 % of the inputs' value purchased through informal channels
99 99 99
Sub-Saharan Africa Ethiopia, 2012 % of the inputs' value purchased through formal channels
1 1 1
Sub-Saharan Africa Ethiopia, 2012 % of the inputs' value purchased in local markets
Sub-Saharan Africa Ethiopia, 2012 % of the inputs' value purchased in other markets
Sub-Saharan Africa Ghana, 2013 Sample (% of households reporting inputs)
75 91 79
Sub-Saharan Africa Ghana, 2013 % of households buying ag. inputs through informal channels
93 91 92
Sub-Saharan Africa Ghana, 2013 % of households buying ag. inputs through formal channels
7 9 8
Sub-Saharan Africa Ghana, 2013 % of households buying ag. inputs in the local markets
Sub-Saharan Africa Ghana, 2013 % of households buying ag. Inputs in the other markets
Sub-Saharan Africa Ghana, 2013 % of the inputs' value purchased through informal channels
92 90 92
Sub-Saharan Africa Ghana, 2013 % of the inputs' value purchased through formal channels
8 10 8
Sub-Saharan Africa Ghana, 2013 % of the inputs' value purchased in local markets
Sub-Saharan Africa Ghana, 2013 % of the inputs' value purchased in other markets
Sub-Saharan Africa Kenya, 2005 Sample (% of households reporting inputs)
88 90 88
Sub-Saharan Africa Kenya, 2005 % of households buying ag. inputs through informal channels
43 40 42
Sub-Saharan Africa Kenya, 2005 % of households buying ag. inputs through formal channels
57 60 58
Sub-Saharan Africa Kenya, 2005 % of households buying ag. inputs in the local markets
42 40 42
Sub-Saharan Africa Kenya, 2005 % of households buying ag. Inputs in the other markets
58 60 58
Sub-Saharan Africa Kenya, 2005 % of the inputs' value purchased through informal channels
39 38 39
Sub-Saharan Africa Kenya, 2005 % of the inputs' value purchased through formal channels
61 62 61
Sub-Saharan Africa Kenya, 2005 % of the inputs' value purchased in local markets
39 37 38
Sub-Saharan Africa Kenya, 2005 % of the inputs' value purchased in other markets
61 63 62
Sub-Saharan Africa Malawi, 2011 Sample (% of households reporting inputs)
61 72 64
Sub-Saharan Africa Malawi, 2011 % of households buying ag. inputs through informal channels
100 100 100
Sub-Saharan Africa Malawi, 2011 % of households buying ag. inputs through formal channels
0 0 0
Sub-Saharan Africa Malawi, 2011 % of households buying ag. inputs in the local markets
98 96 97
Sub-Saharan Africa Malawi, 2011 % of households buying ag. Inputs in the other markets
2 4 3
Sub-Saharan Africa Malawi, 2011 % of the inputs' value purchased through informal channels
100 100 100
Sub-Saharan Africa Malawi, 2011 % of the inputs' value purchased through formal channels
0 0 0
Sub-Saharan Africa Malawi, 2011 % of the inputs' value purchased in local markets
98 96 97
Sub-Saharan Africa Malawi, 2011 % of the inputs' value purchased in other markets
2 4 3
Sub-Saharan Africa Niger, 2011 Sample (% of households reporting inputs)
100 100 100
Sub-Saharan Africa Niger, 2011 % of households buying ag. inputs through informal channels
97 98 98
Sub-Saharan Africa Niger, 2011 % of households buying ag. inputs through formal channels
3 2 2
Sub-Saharan Africa Niger, 2011 % of households buying ag. inputs in the local markets
71 75 72
Sub-Saharan Africa Niger, 2011 % of households buying ag. Inputs in the other markets
29 25 28
Sub-Saharan Africa Niger, 2011 % of the inputs' value purchased through informal channels
92 94 93
Sub-Saharan Africa Niger, 2011 % of the inputs' value purchased through formal channels
8 6 7
Sub-Saharan Africa Niger, 2011 % of the inputs' value purchased in local markets
91 94 92
Sub-Saharan Africa Niger, 2011 % of the inputs' value purchased in other markets
9 6 8
Sub-Saharan Africa Nigeria, 2013 Sample (% of households reporting inputs)
58 58 58
Sub-Saharan Africa Nigeria, 2013 % of households buying ag. inputs through informal channels
100 100 100
Sub-Saharan Africa Nigeria, 2013 % of households buying ag. inputs through formal channels
0 0 0
Sub-Saharan Africa Nigeria, 2013 % of households buying ag. inputs in the local markets
94 93 94
Sub-Saharan Africa Nigeria, 2013 % of households buying ag. Inputs in the other markets
6 7 6
Sub-Saharan Africa Nigeria, 2013 % of the inputs' value purchased through informal channels
100 100 100
Sub-Saharan Africa Nigeria, 2013 % of the inputs' value purchased through formal channels
0 0 0
Sub-Saharan Africa Nigeria, 2013 % of the inputs' value purchased in local markets
95 94 95
Sub-Saharan Africa Nigeria, 2013 % of the inputs' value purchased in other markets
5 6 5
Sub-Saharan Africa Uganda, 2012 Sample (% of households reporting inputs)
14 22 15
Sub-Saharan Africa Uganda, 2012 % of households buying ag. inputs through informal channels
6 2 5
Sub-Saharan Africa Uganda, 2012 % of households buying ag. inputs through formal channels
94 98 95
Sub-Saharan Africa Uganda, 2012 % of households buying ag. inputs in the local markets
53 38 51
Sub-Saharan Africa Uganda, 2012 % of households buying ag. Inputs in the other markets
47 62 49
Sub-Saharan Africa Uganda, 2012 % of the inputs' value purchased through informal channels
6 2 5
Sub-Saharan Africa Uganda, 2012 % of the inputs' value purchased through formal channels
94 98 95
Sub-Saharan Africa Uganda, 2012 % of the inputs' value purchased in local markets
53 39 50
Sub-Saharan Africa Uganda, 2012 % of the inputs' value purchased in other markets
47 61 50
Sub-Saharan Africa United Republic of Tanzania, 2013 Sample (% of households reporting inputs)
57 60 58
Sub-Saharan Africa United Republic of Tanzania, 2013 % of households buying ag. inputs through informal channels
99 99 99
Sub-Saharan Africa United Republic of Tanzania, 2013 % of households buying ag. inputs through formal channels
1 1 1
Sub-Saharan Africa United Republic of Tanzania, 2013 % of households buying ag. inputs in the local markets
99 99 99
Sub-Saharan Africa United Republic of Tanzania, 2013 % of households buying ag. Inputs in the other markets
1 1 1
Sub-Saharan Africa United Republic of Tanzania, 2013 % of the inputs' value purchased through informal channels
99 100 99
Sub-Saharan Africa United Republic of Tanzania, 2013 % of the inputs' value purchased through formal channels
1 0 1
Sub-Saharan Africa United Republic of Tanzania, 2013 % of the inputs' value purchased in local markets
99 100 99
Sub-Saharan Africa United Republic of Tanzania, 2013 % of the inputs' value purchased in other markets
1 0 1
Asia Bangladesh, 2005 Sample (% of households reporting inputs)
Asia Bangladesh, 2005 % of households buying ag. inputs through informal channels
Asia Bangladesh, 2005 % of households buying ag. inputs through formal channels
Asia Bangladesh, 2005 % of households buying ag. inputs in the local markets
Asia Bangladesh, 2005 % of households buying ag. Inputs in the other markets
Asia Bangladesh, 2005 % of the inputs' value purchased through informal channels
Asia Bangladesh, 2005 % of the inputs' value purchased through formal channels
Asia Bangladesh, 2005 % of the inputs' value purchased in local markets
Asia Bangladesh, 2005 % of the inputs' value purchased in other markets
Asia Cambodia, 2004 Sample (% of households reporting inputs)
Asia Cambodia, 2004 % of households buying ag. inputs through informal channels
Asia Cambodia, 2004 % of households buying ag. inputs through formal channels
Asia Cambodia, 2004 % of households buying ag. inputs in the local markets
Asia Cambodia, 2004 % of households buying ag. Inputs in the other markets
Asia Cambodia, 2004 % of the inputs' value purchased through informal channels
Asia Cambodia, 2004 % of the inputs' value purchased through formal channels
Asia Cambodia, 2004 % of the inputs' value purchased in local markets
Asia Cambodia, 2004 % of the inputs' value purchased in other markets
Asia Indonesia, 2000 Sample (% of households reporting inputs)
Asia Indonesia, 2000 % of households buying ag. inputs through informal channels
Asia Indonesia, 2000 % of households buying ag. inputs through formal channels
Asia Indonesia, 2000 % of households buying ag. inputs in the local markets
Asia Indonesia, 2000 % of households buying ag. Inputs in the other markets
Asia Indonesia, 2000 % of the inputs' value purchased through informal channels
Asia Indonesia, 2000 % of the inputs' value purchased through formal channels
Asia Indonesia, 2000 % of the inputs' value purchased in local markets
Asia Indonesia, 2000 % of the inputs' value purchased in other markets
Asia Nepal, 2003 Sample (% of households reporting inputs)
42 50 44
Asia Nepal, 2003 % of households buying ag. inputs through informal channels
25 23 24
Asia Nepal, 2003 % of households buying ag. inputs through formal channels
75 77 76
Asia Nepal, 2003 % of households buying ag. inputs in the local markets
31 31 31
Asia Nepal, 2003 % of households buying ag. Inputs in the other markets
69 69 69
Asia Nepal, 2003 % of the inputs' value purchased through informal channels
25 24 25
Asia Nepal, 2003 % of the inputs' value purchased through formal channels
75 76 75
Asia Nepal, 2003 % of the inputs' value purchased in local markets
31 31 31
Asia Nepal, 2003 % of the inputs' value purchased in other markets
69 69 69
Asia Viet Nam, 2008 Sample (% of households reporting inputs)
Asia Viet Nam, 2008 % of households buying ag. inputs through informal channels
Asia Viet Nam, 2008 % of households buying ag. inputs through formal channels
Asia Viet Nam, 2008 % of households buying ag. inputs in the local markets
Asia Viet Nam, 2008 % of households buying ag. Inputs in the other markets
Asia Viet Nam, 2008 % of the inputs' value purchased through informal channels
Asia Viet Nam, 2008 % of the inputs' value purchased through formal channels
Asia Viet Nam, 2008 % of the inputs' value purchased in local markets
Asia Viet Nam, 2008 % of the inputs' value purchased in other markets
Latin America and the Caribbean Bolivia (Plurinational State of), 2005 Sample (% of households reporting inputs)
Latin America and the Caribbean Bolivia (Plurinational State of), 2005 % of households buying ag. inputs through informal channels
Latin America and the Caribbean Bolivia (Plurinational State of), 2005 % of households buying ag. inputs through formal channels
Latin America and the Caribbean Bolivia (Plurinational State of), 2005 % of households buying ag. inputs in the local markets
Latin America and the Caribbean Bolivia (Plurinational State of), 2005 % of households buying ag. Inputs in the other markets
Latin America and the Caribbean Bolivia (Plurinational State of), 2005 % of the inputs' value purchased through informal channels
Latin America and the Caribbean Bolivia (Plurinational State of), 2005 % of the inputs' value purchased through formal channels
Latin America and the Caribbean Bolivia (Plurinational State of), 2005 % of the inputs' value purchased in local markets
Latin America and the Caribbean Bolivia (Plurinational State of), 2005 % of the inputs' value purchased in other markets
Latin America and the Caribbean Guatemala, 2006 Sample (% of households reporting inputs)
Latin America and the Caribbean Guatemala, 2006 % of households buying ag. inputs through informal channels
Latin America and the Caribbean Guatemala, 2006 % of households buying ag. inputs through formal channels
Latin America and the Caribbean Guatemala, 2006 % of households buying ag. inputs in the local markets
Latin America and the Caribbean Guatemala, 2006 % of households buying ag. Inputs in the other markets
Latin America and the Caribbean Guatemala, 2006 % of the inputs' value purchased through informal channels
Latin America and the Caribbean Guatemala, 2006 % of the inputs' value purchased through formal channels
Latin America and the Caribbean Guatemala, 2006 % of the inputs' value purchased in local markets
Latin America and the Caribbean Guatemala, 2006 % of the inputs' value purchased in other markets
Latin America and the Caribbean Nicaragua, 2005 Sample (% of households reporting inputs)
Latin America and the Caribbean Nicaragua, 2005 % of households buying ag. inputs through informal channels
Latin America and the Caribbean Nicaragua, 2005 % of households buying ag. inputs through formal channels
Latin America and the Caribbean Nicaragua, 2005 % of households buying ag. inputs in the local markets
Latin America and the Caribbean Nicaragua, 2005 % of households buying ag. Inputs in the other markets
Latin America and the Caribbean Nicaragua, 2005 % of the inputs' value purchased through informal channels
Latin America and the Caribbean Nicaragua, 2005 % of the inputs' value purchased through formal channels
Latin America and the Caribbean Nicaragua, 2005 % of the inputs' value purchased in local markets
Latin America and the Caribbean Nicaragua, 2005 % of the inputs' value purchased in other markets
Latin America and the Caribbean Panama, 2003 Sample (% of households reporting inputs)
45 61 45
Latin America and the Caribbean Panama, 2003 % of households buying ag. inputs through informal channels
15 11 15
Latin America and the Caribbean Panama, 2003 % of households buying ag. inputs through formal channels
85 89 85
Latin America and the Caribbean Panama, 2003 % of households buying ag. inputs in the local markets
74 73 74
Latin America and the Caribbean Panama, 2003 % of households buying ag. Inputs in the other markets
26 27 26
Latin America and the Caribbean Panama, 2003 % of the inputs' value purchased through informal channels
14 8 14
Latin America and the Caribbean Panama, 2003 % of the inputs' value purchased through formal channels
86 92 86
Latin America and the Caribbean Panama, 2003 % of the inputs' value purchased in local markets
75 75 75
Latin America and the Caribbean Panama, 2003 % of the inputs' value purchased in other markets
25 25 25
Europe & Central Asia Albania, 2005 Sample (% of households reporting inputs)
Europe & Central Asia Albania, 2005 % of households buying ag. inputs through informal channels
Europe & Central Asia Albania, 2005 % of households buying ag. inputs through formal channels
Europe & Central Asia Albania, 2005 % of households buying ag. inputs in the local markets
Europe & Central Asia Albania, 2005 % of households buying ag. Inputs in the other markets
Europe & Central Asia Albania, 2005 % of the inputs' value purchased through informal channels
Europe & Central Asia Albania, 2005 % of the inputs' value purchased through formal channels
Europe & Central Asia Albania, 2005 % of the inputs' value purchased in local markets
Europe & Central Asia Albania, 2005 % of the inputs' value purchased in other markets
Europe & Central Asia Tajikistan, 2007 Sample (% of households reporting inputs)
54 71 56
Europe & Central Asia Tajikistan, 2007 % of households buying ag. inputs through informal channels
7 4 6
Europe & Central Asia Tajikistan, 2007 % of households buying ag. inputs through formal channels
93 96 94
Europe & Central Asia Tajikistan, 2007 % of households buying ag. inputs in the local markets
90 92 91
Europe & Central Asia Tajikistan, 2007 % of households buying ag. Inputs in the other markets
10 8 9
Europe & Central Asia Tajikistan, 2007 % of the inputs' value purchased through informal channels
7 4 6
Europe & Central Asia Tajikistan, 2007 % of the inputs' value purchased through formal channels
93 96 94
Europe & Central Asia Tajikistan, 2007 % of the inputs' value purchased in local markets
90 92 91
Europe & Central Asia Tajikistan, 2007 % of the inputs' value purchased in other markets
10 8 9

Notes:

Sample (% of households reporting inputs)
% of households buying ag. inputs through informal channels
% of households buying ag. inputs through formal channels
% of households buying ag. inputs in the local markets
% of households buying ag. Inputs in the other markets
% of the inputs' value purchased through informal channels
% of the inputs' value purchased through formal channels
% of the inputs' value purchased in local markets
% of the inputs' value purchased in other markets
Save data...