Graphs and maps

Source: The State of the World’s Land and Water Resources for Food and Agriculture (SOLAW, 2011)

Source: The State of the World’s Land and Water Resources for Food and Agriculture (SOLAW, 2011)

Source: The State of the World’s Land and Water Resources for Food and Agriculture (SOLAW, 2011)

Source: The State of the World’s Land and Water Resources for Food and Agriculture (SOLAW, 2011)

Source: The State of the World’s Land and Water Resources for Food and Agriculture (SOLAW, 2011)

Source: The State of the World’s Land and Water Resources for Food and Agriculture (SOLAW, 2011)

Graph showing estimated world water use in Reservoir losses, Municipal, Industry & Agriculture areas.
")
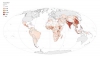
In global studies related to water use, food production or climate change, knowing the location of irrigate agriculture is important in order to assess better the impact of water use on the available water resources. The Global map of irrigation areas shows the amount of area equipped for irrigation around [...]

Map displaying areas of physical and economic water scarcity in varying degrees of severity. Taken from the Comprehensive Assessment of Water Management in Agriculture.