FAO.org
| Frequently Asked Questions (FAQs) |
| Questions are grouped into two categories: Understanding data and Data Handling. Understanding Data section aims to help user understand quickly the methodology and algorithms used when computing ASIS datasets. Data Handling section lists more practical hands-on questions, such as how to efficiently navigate the website, common-used or new-introduced functions etc. For fully-fledged ASIS documentation, please refer to the Reference page on this website. If you want to suggest a new question or you have better answer to the questions listed, you are welcome to write to [email protected]. |
1. What is the advantage of ASIS compared with other remote sensing systems that use vegetation indices? 
Drought is an abnormal climate event which does not happen every year. One of the advantages of ASIS is the length and spatial resolution of the ASIS dataset. It contains over 40 years (from 1984 to date) raster imagery at 1 km spatial resolution, each 1 km pixel contains long time memory of the extreme drought suffered during the 40 years. The long length and resolution of the dataset enables to establish a more complete and precise baseline dataset, which is fundamental to perform the analysis. Other remote sensing systems may have data with higher resolution, but the temporal coverage may not stretch back to 1984.
The other advantage is that ASIS introduces crop coefficients in the calibration process, which means it takes into consideration of the sensitivity of a crop to -water stress during each phenological phase. The last one is the sustainability of the ASIS. To support FAO’s food security monitoring and early warning activities (mainly under GIEWS), since 2012, FAO, together with other partners, have provided strong technical support to the daily operation of ASIS, both data archive and near real time data used by Country ASIS is disseminated freely every 10 days. | ||||||||||||||||
| 2. What are the differences between seasonal and non-seasonal indicators in ASIS?
Seasonal indicators are designed to allow easy identification of areas of cropped land with a high likelihood of water stress (drought). They combine non-seasonal indictors (vegetation and land surface temperature) with information on crop mask and agricultural cropping cycles derived from historical data. Thus, the location of the crop, the crop phenological phase (sowing dates and the length of the cropping cycle, etc.) and the sensitivity to water stress of each phenological phase are important inputs during seasonal indictors' calibration process. For example, the area where no crop/pasture grows is excluded in calibration; certain areas are marked as "off season" if the period observed on this area is out of the cropping cycles; for cereals, the most sensitive phases are flowering and grain-filling. The final outputs highlight anomalous vegetation growth and potential drought in crop zones during the growing season.
| ||||||||||||||||
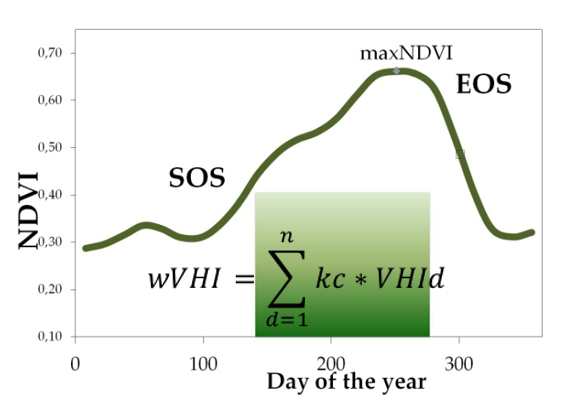
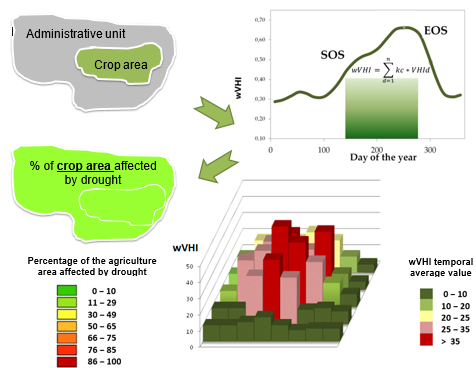
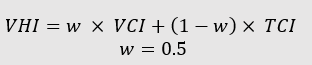
3. What are the differences between three seasonal indicators in ASIS: ASI, Drought Intensity and Weighted Mean VHI?
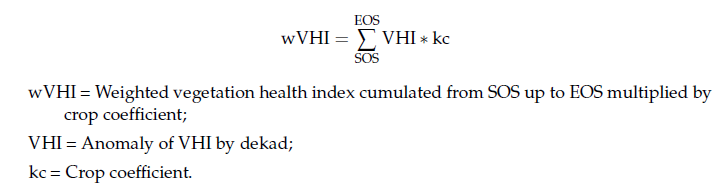
All these indictors start with the calculation of Weighted Mean VHI. Weighted Mean VHI (wVHI) is an average of the dekadal VHI values over the crop growing season (from the start until the last dekad of analysis), weighted by crop coefficients (Kc), assigned to VHI values at the dekads corresponding to the Start of the Season (SOS), Maximum of the Season (MOS) and End of the Season (EOS). Crop coefficient is applied for the purpose of reflecting the crop’s water sensitivity at different phenology stages.
 Based on Weighted Mean VHI, two seasonal indicators are calculated: Agricultural Stress Index (ASI) and Drought Intensity. A pixel, which is flagged as crop by land use map/crop mask, with Weighted Mean VHI below 0.35 is defined as a drought pixel. Agricultural Stress Index (ASI) refers to the percentage of arable area affected by drought. It reflects both the temporal and spatial extent of drought events. In Global ASIS, the spatial analysis unit is GAUL level 2 (level 0: national level, level 1: sub-national/province level). To facilitate the quick interpretation of the results by analysts, each administrative area then is classified according to its percentage of the affected area.
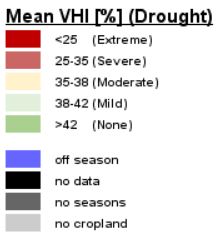
Drought Intensity Indicator classifies the Weighted Mean VHI values, aggregated per GAUL 2 region, into four levels: Extreme, Severe, Moderate or Mild. The area with Mean VHI above 42% is considered no water stress.
| ||||||||||||||||
4. What are the crop phenology and crop coefficient? How are they used in ASIS and beyond?
Crop phenology defines physiological development stages of crop growth from planting to harvest. Crop growth monitoring and yield estimation require accurate crop phenology information during the growing season. The water consumption of the crop varies during the different growing stages. Water stress in different crop growth stages may affect crop yield differently. Different crops also have different water requirements. Crop coefficient (kc) is introduced to reflect the water requirement differences/sensitivities in different crop development stages and for different crop types. In ASIS, crop coefficients are used (multiply by VHI over the growing stages) to give the sensitivity of the model.
 | ||||||||||||||||
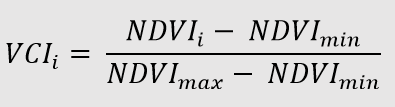
5. What are the advantages of using standardized vegetation indices (VCI, TCI and VHI)?
When establishing the baseline dataset for anomaly analysis, the simple approach is to create a baseline based on the average of the past values. This baseline dataset may not be very stable if the length of the data is not long, also the cross-location comparison may not be meaningful as the land cover character various over the locations. For example, the average of NDVI time series of an area in Amazon rainforest will always be higher than that in pasture area in the Sahel region. VCI, TCI and VHI take an approach that is more complicated. Maximum and minimum values of the NDVI time series are used to compute the indices (see Table in Question 6). The index is expressed as a numeric value range from 0 to 1. In this way, the index value at any location and on any time scale is consistent, no matter the land cover character of the location. It makes the cross location and/or cross time comparison possible. Of course, if the land cover status of an area changes over time, for example, cut the forest and plant maize, a noise could be introduced. As the maximum and minimum values of NDVI of cropland and forest are different.
| ||||||||||||||||
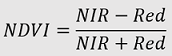
6. What are the differences between NDVI, NDVI Anomaly, VCI, and VHI and when to use them?
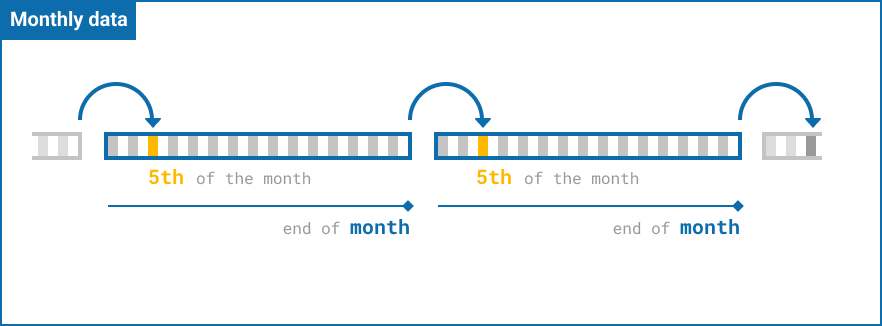
In ASIS, NDVI, NDVI Anomaly, VCI and VHI are called “non-seasonal indictors” which purely indicate the biomass produced by the vegetation of ground cover. Crop phenology and crop type planted on the ground are not considered when constructing these indicators. All non-seasonal indictors are computed in two modalities: dekadal and monthly. In ASIS, NDVI anomaly, VCI and VHI are presented in map format, while NDVI absolute values (zonal statistics at GAUL level 1) are shown in graph format. Users can also download NDVI and VHI data in tabular form or explore the data through a dynamic data viewer.
| ||||||||||||||||
7. It is possible to increase the spatial resolution of ASIS from 1 km to 250 m, 40 m or less?
From 1 km to 250 m, yes, it is possible but some challenges have to be solved. What we need to do is some kind of calibration study between sensors or extrapolate the maximum and minimum values to the new sensor, assuming that these maximum and minimum values will be used as baseline dataset for new sensor. Of course, there will be noise.
From 1 km to 40 m, maybe not. There will be too much noise between these quite different resolutions. | ||||||||||||||||
8. What cropland map is used in Global ASIS and what does it depict/include?
The cropland map used in Global ASIS is GLC-Share produced by FAO: https://data.apps.fao.org/map/catalog/srv/eng/catalog.search#/metadata/ba4526fd-cdbf-4028-a1bd-5a559c4bff38 , the cropland layer of GLC-Share refers to collective crops, which puts ten different types of main crops (wheat, rice, maize, barley, etc.) together. In Country ASIS, it is possible to introduce crop-specific cropland maps.
| ||||||||||||||||
9. Does crop mask used in ASIS reflect actual cropping patterns in the season?
No. The crop mask used in Global ASIS is extracted from GLC-Share, a static land cover map. It does not reflect the actual cropping patterns. Up to now none of the agricultural monitoring system at global scale uses dynamic crop mask as it is very expensive to implement. However, we expect that this can be solved in the future.
| ||||||||||||||||
10. Do Progress of Season maps capture an actual progress of the ongoing season?
No. In ASIS, the seasons’ progress is based on the long-term average of vegetation phenology for each pixel, derived from long-term averages of NDVI imagery received from SPOT Vegetation. This simplification implies that the crop/pasture phenology is static and, therefore, the growing seasons progress at a constant rate each year. The progress season map can be used as a “proxy” to understand the general pattern of the crop phenology.
| ||||||||||||||||
11. How does the tool treat large bodies of water? Why sometimes they have the same colour as drought?
Normally, there is a specific mask/map dedicated to mark large water bodies. This map is masked out/excluded when computing ASIS indicators. The pixels represent water bodies are marked with a colour different from all the other colours shown on the map legend. (In ASIS, the colour of water body is the same as the background of the map: white). If the pixel inside the large water bodies is flagged with a colour the same as other colours shown on the legend, users can contact [email protected] and discuss the issue in more detail.
| ||||||||||||||||
12. Is ASIS useful in crop irrigation areas?
Yes, definitely. The cornerstone indicator of ASIS is Vegetation Health Index (VHI). Vegetation-based indices describe the crop-growing condition more directly and reflect the impacts of technical inputs/interventions delivered during the crop-growing phases such as the application of pesticides, fertilizers and irrigation during periods of water shortfall. We have tested ASIS in Viet Nam and it showed the occurrence of agricultural drought due to lack of water in reservoirs during the El Niño years.
| ||||||||||||||||
13. What are the main limitations of ASIS and which indicator could complement ASIS?
The main limitation of ASIS, same as other vegetation indices-based systems, is the quality of the satellite imagery impacted by the cloud. The satellite sensor cannot capture the ground vegetation information properly on the areas covered by the cloud. Although data cleaning is performed afterward, some areas, like highland, if covered by cloud most of the year, the cleaning will be difficult and noise may be introduced in the data. This limitation can be complemented by using a water-balance model with good resolution. Another limitation is that ASIS uses a static crop mask which does not reflect actual cropping patterns in the season. Applying a dynamic crop mask at global scale is very challenging and resource demanding. Up to now, there is no global agricultural monitoring system which uses dynamic crop mask. The drone technology can be used locally to help verify and correct the inconsistency and eliminate the noises introduced at certain scale.
| ||||||||||||||||
14. What is the difference between Global ASIS and Country level ASIS?
The reason to implement a Country level ASIS is that FAO acknowledged that some hypotheses and data used in Global ASIS are not applicable at country level. The major difference between Global ASIS and Country level ASIS is that Country ASIS enjoys more flexibilities on adjusting the core input parameters at local level with no change on the main methodology/algorithm. Global ASIS provides the raw satellite imagery archive to Country level ASIS when setting up the system in the country, as well as the operational imagery every ten days. To list a few differences:
| ||||||||||||||||

1. What are the differences between GIEWS ASIS website and ASIS datasets on FAO Hand in Hand (HiH) Geospatial Platform?
Please watch this short video and get to know.
|
2. How to zoom on the maps on ASIS website in more detail?
Follow this 1 minute demo video:
|
3. How to know the location name/geo-information of a specific area on ASIS raster layer?
This short video shows and explains!
|
4. How to visualize ASIS time series data spatial-aggregated at difference administrative level on HiH Geospatial Platform?
Very easy! Here is the URL of FAO HiH Geospatial Platform: https://data.apps.fao.org/, look for a Comma Separate Value (CSV) file on ASIS website, follow this 1 minute video and have a try yourself!
|
5. How to access ASIS raster datasets?
ASIS raster (geo-referenced) datasets can be accessed in various ways, either through geo-spatial platforms such as FAO Agro-informatics Platform, Google Earth Engine, ESRI Living Atlas, or you can access the datasets through Web Map Service (WMS) provided by FAO. Please consult the Data Access page on this website for details.
|
6. Does FAO provide technical support for manipulation of Global ASIS raster datasets distributed through WMS service/on Google Earth Engine (GEE)/ESRI Living Atlas?
FAO provides technical support for accessing the data (files in raster format) but not for further manipulation or processing. However, most GIS/Satellite Imagery processing software and Geospatial platform provide detailed documentation and user manuals, which you can refer to. Take a GIS course focusing on raster imagery processing/analysis is also a good idea. You may find some GIS /Remote sensing communities would also be helpful.
Some convenient and freely available software:
Some FAO free e-learning courses, which deal with basic raster operations for early warning, could be useful:
|
7. If I cannot open a raster file in another application, what should I do?
The file size of the raster imagery is quite big. Seasonal indicators like ASI, Drought Intensity, a single raster layer is around 50 Megabytes, non-seasonal indictors like VCI, VHI, around 350 Megabytes. Make sure you have good internet connection. Also make sure you use proper GIS software/Geospatial platform which can handle the raster imagery (see question 6).
|
8. I am only interested in a specific region, not the whole country. What should I do?
Like you do on Google Map, you can use Interactive Zoom function provided by the Geospatial platform (such as HiH, Living Atlas) to look into the region.
All the ASIS raster datasets are global extent. Advanced user may use clip function provided by the raster image processing software/platform to manipulate the files through programing. |
9. Why NDVI and precipitation maps shown on this website can’t be found on FAO HiH Geospatial and other online platforms (GEE, ESRI Living Atlas)?
Due to copy right constrains, FAO is not in the position to distribute these datasets.
|
10. Is there a data updating schedule?
Yes.
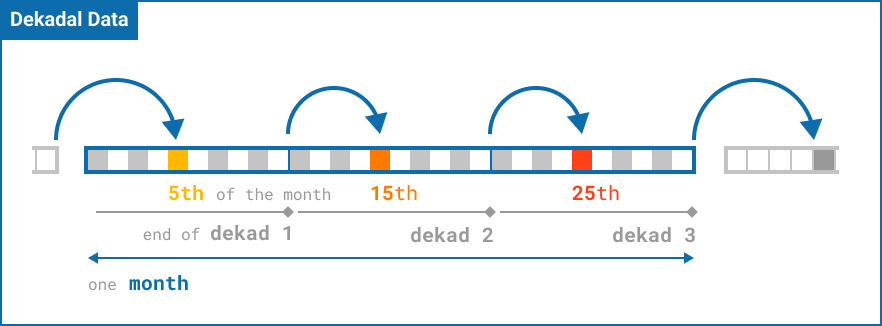
Dekadal data: around 4-5 days after a dekad ends.
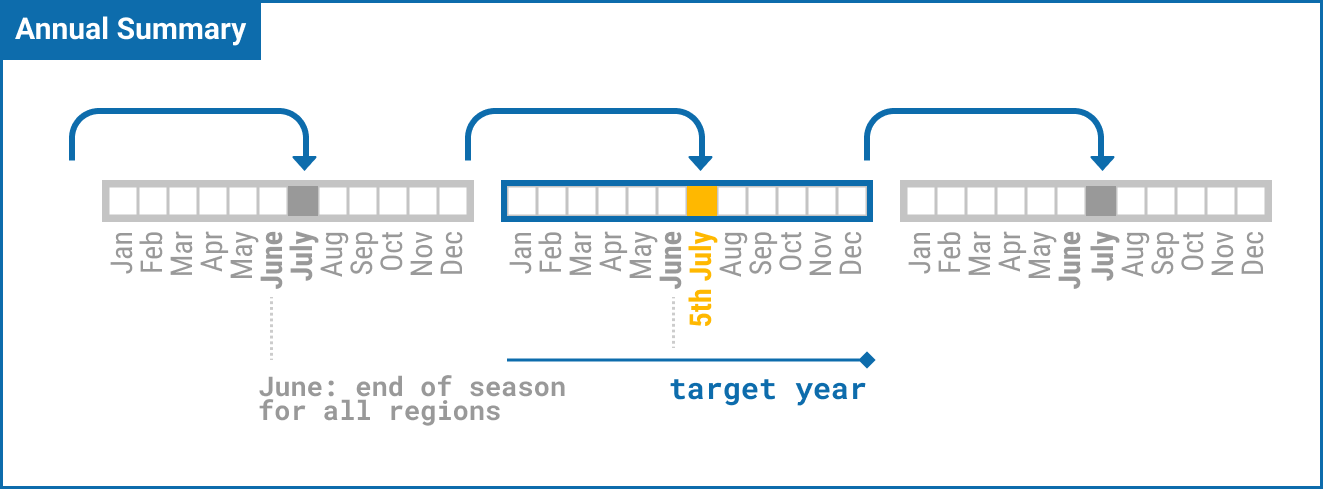
Annual Summary data: around 5th of July for the previous crop year. Global ASIS covers two seasons. Crop phenology detecting for all regions in the world stretches from 12 months before the target year to 12 months after the target year. According to the long-term NDVI profile, June of the year after the target year is the end of season for all regions.
|
11. Who is responsible for maintaining operational Country level ASIS?
Governments/institutions who set-up the ASIS at country level.
ASIS data processing software as well as the satellite imagery used by the software are provided by FAO to the government/institution free of charge. FAO also provides the technical support on initial system setting-up and training to the government/institution, usually through a TCP Project. Find more information here: https://www.fao.org/giews/earthobservation/asistool.jsp |
12. Are there zonal statistics available for the ASIS raster datasets?
Yes, on this website you can find pre-calculated zonal statistics in CSV format for some of the ASIS raster datasets. Below is a summary table.
|