Map stories
Map stories are hosted on the Hand in Hand platform and allow users to showcase the data on the platform alongside a narrative that may provide more context to the data. WaPOR data and its use are at the center of the map stories below:

The use of WaPOR data in the cultivation of sugarcane
24/08/2021
This map story shows the way that productivity analysis can be carried with WaPOR data in order to understand the spatially explicit attainable water and land productivities of an area of interest, identify the zones where these productivities are met and derive from that analysis best practices to increase the productivity of the area as a whole with the goal of producing more while using less water.
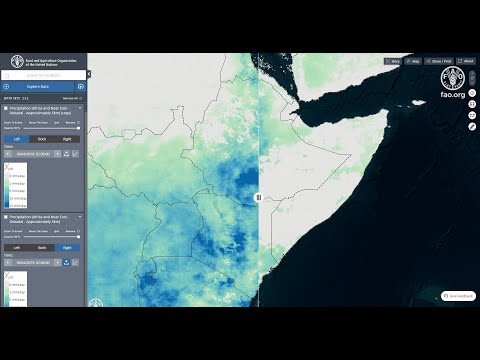
The use of WaPOR data to monitor agricultural production in near real time
03/09/2021
This video is a walkthrough that shows how WaPOR data can be accessed in the FAO Hand in Hand platform and used in near-real time to take the pulse of the current growing season by comparing metrics such as biomass production between years.