
WaPOR, FAO’s portal to monitor Water Productivity through Open access of Remotely sensed derived data, monitors and reports on agriculture water productivity over Africa and the Near East.
It provides open access to the water productivity database and its thousands of underlying map layers. It allows for direct data queries, time series analyses, area statistics and data download of key variables associated to water and land productivity assessments.
The portal’s services are directly accessible through dedicated FAO WaPOR APIs, which are being gradually published and documented through the
FAO API site.
Water productivity assessments and other computation–intensive calculations are powered by Google Earth Engin

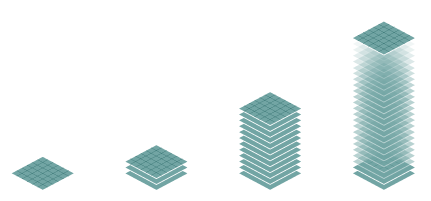
WaPOR data is available to users at 3 different levels corresponding to different resolutions at which different applications for the data are possible.
 | Level I
Level II
Level III | global level
continental and national level
irrigation scheme and sub-basin | 300 m resolution
100 m
20 m |
At level I, water productivity is monitored in terms of biomass production per hectare per cubic meter of water consumed. A distinction is made between irrigated and rainfed agriculture. Land and water productivity are calculated on pixel basis, which can be aggregated to country or river basin level.
At level II, land and water productivity is monitored for a selected set of countries and river basins while distinguishing several main crops under irrigated or rainfed agriculture. Land productivity is expressed in terms of yield (kg/ha), water productivity is calculated as production per volume of water (kg/m³). Water used for agricultural production is expressed in actual evapotranspiration, where a distinction is made between evapotranspiration originating from precipitation (‘green’ water) and incremental evaporation originating from irrigation (‘blue’ water).
At level III, land and water productivity is monitored for a selected set of areas including irrigation schemes to assess the functioning of the irrigation system and to propose improvements of these systems. The particularity of these areas is that they are connected to project tools and solutions co-development and capacity building activities with
partner countries. At this level, land and water productivity is calculated similarly to level II. In addition, economic water productivity for multiple uses of water is assessed in terms of economic return per amount of irrigation water used. Indeed, water productivity plays a central role in the performance assessment of irrigation which is the basis of irrigation modernization. After modernization of an irrigation scheme, the water services provided to all water users should be more reliable, more cost effective, more adapted to increased climatic variability due to climate change and more environmentally friendly.
In the work that the project does with partner countries at spatial level III, special emphasis is given to the multiple uses of water services (MUS) in agriculture. MUS can provide the more vulnerable water users with low cost services for domestic water, water for homesteads, water for livestock, habitats for fish and other aquatic resources and rural enterprise water supplies. The multiple uses of water services often increases the economic productivity of water use in irrigation schemes. Within multiple uses of water services, gender relations are of main interest.
The WaPOR database provides the following data layers:
 | Evapotranspiration Land Cover Classification Net Primary Productivity Precipitation Phenology Quality layers Reference evapotranspiration Relative soil moisture Total Biomass Production Water Productivity |
Consult the catalogue for more information, or the WaPOR data and methodology wiki.
For more information about how the different layers can be used, consult the applications catalogue where the entries are sorted according to the data layers used.
The three levels of WaPOR data are available for different areas

 | | The global level (300m resolution) that covers the entire globe. |
 | | The continental and national / river basin level (100 m ground resolution) Northern and sub-Saharan Africa and the Near East (roughly a square of -30W, -40S, 65E, 40N) |
 The irrigation scheme and sub-basin (20 m ground resolution) available for these areas:
| | |
- Koga ** and Awash (Ethiopia)
| | |
| | |
| | |
- Malwathu Oya West Subcatchment (Sri Lanka) **
| | - Lower Akagera, Muvumba and Yanze catchments (Rwanda) **
|
| | |
- Fezzan, Tarhona, Waddan regions (Libya)
| | |
** upon release of V3, the near real time data production for these areas will stop.
WaPOR data is made available at different frequencies, depending on the data layer and the resolution in question.
For example, Actual Evapotranspiration and Interception is is made available annually, monthly and dekadally (every 10 days) at all resolutions, whereas Land Cover Classification is made available every 10 days at 20m resolution and annually at 100m and 200m. Gross Biomass Water Productivity is always made available seasonally.
Available temporal resolutions are:
 | - annual
- seasonal
- monthly
- dekadal (every 10 days)
- daily
|
Consult the catalogue for more information, or the WaPOR data and methodology wiki.