Seeing the Big Picture: How graphic facilitation can unlock the potential of your evaluation
Significant learning from evaluations occurs during the evaluation itself. How can we enhance this learning process to achieve greater impact? Discover how an evaluation team used a graphic facilitation tool, to increase participation, learning, and ownership in evaluating FAO’s work in Uganda.

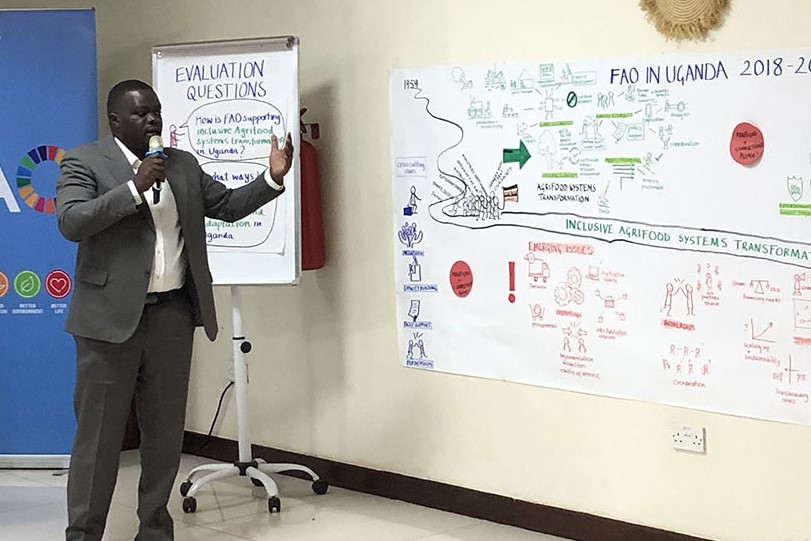
©Eric Wakabi
As the first stage of the Uganda Country Programme (2018 – 2024) review concluded, the evaluation team aimed to maximise the usefulness of debriefing workshops with national stakeholders and the FAO country office team. The goal was to validate preliminary findings, collect additional data and insights and gather feedback to guide the next stages of the evaluation. This led the team to ask: could graphic facilitation transform workshops into spaces for deeper learning and collaboration?
Graphic facilitation in action
The evaluation team embarked on piloting a graphic facilitation approach known as Evaluvision. The method uses a visual representation of the preliminary evaluation findings. How did the approach unfold in Uganda and what made it effective?
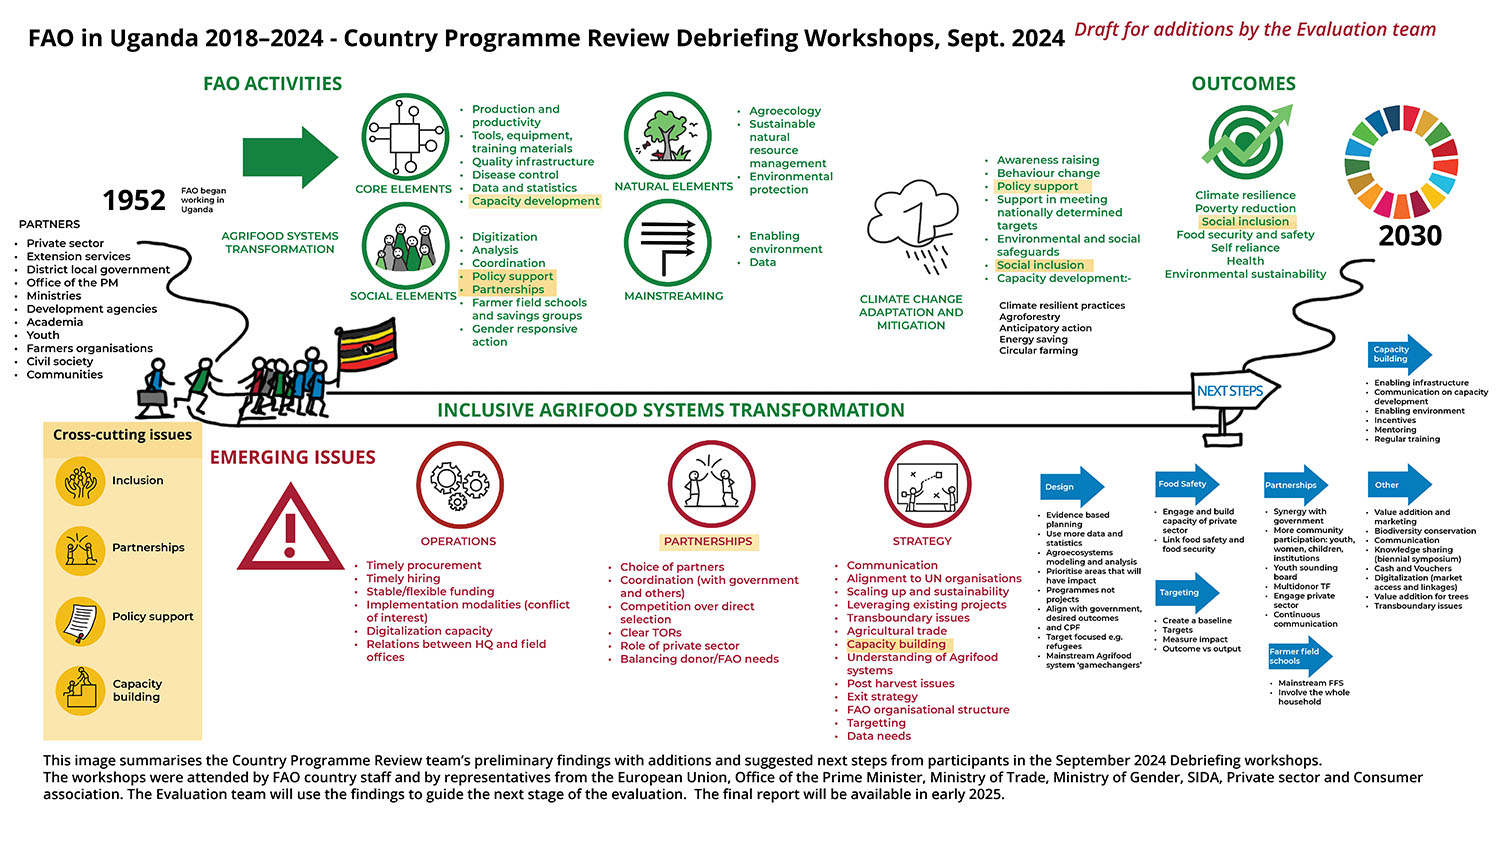
Working together from the planning phase was key. The evaluation team shared the goals of the meeting and reviewed the preliminary findings together with the graphic facilitator. From this discussion, the facilitator designed a journey-themed visual representation, tracing FAO's work in Uganda toward achieving the Sustainable Development Goals in 2030. The template aligned with the evaluation questions, while the overall metaphor set the evaluation in its broader historical and institutional context.

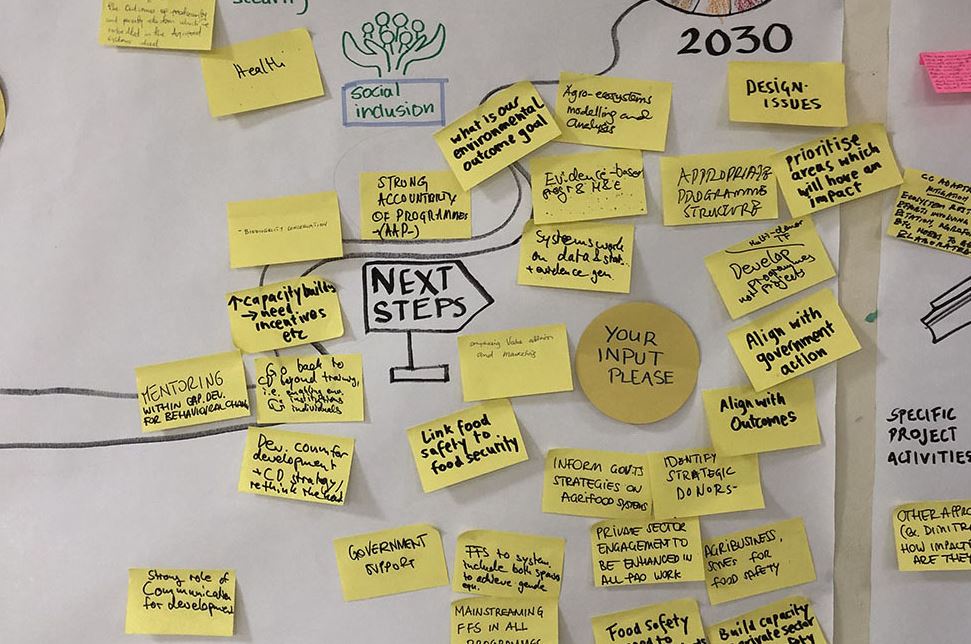
During the meeting, the graphic facilitator used this template to draw the findings as the evaluation team presented them. The visual allowed participants to step back, see the ‘big picture’, and easily identify patterns, trends and gaps. They were invited to add to, correct, or highlight gaps with post-its.

The final image was discussed in plenary to reach a shared story of the evaluation. At the end of the meeting, the facilitator compiled the feedback and shared a final visual representation which included everyone’s contributions.
Benefits for the evaluation
Several outcomes highlight how the graphic facilitation added value to the evaluation process:
⦿ Increased participation and inclusion. Evaluvision led to significantly higher and more animated participation than a standard debriefing workshop. Typically, feedback in such settings is led by senior staff or high-status attendees but this approach challenged traditional dynamics. The anonymity of the post-it contributions meant that junior staff, online attendees, and partners from the private sector and NGOs felt comfortable providing input. By the end, the visual was populated with over 150 post-its, averaging four contributions per participants.

⦿ Generating new insights. The exercise generated extensive feedback on the preliminary findings. Participants didn't just validate information; they brought fresh perspectives and new ideas to the table. For instance, they highlighted delays in staff recruitment, an issue not captured by the team, as well as the need for a more detailed analysis of Farmer Field Schools. Using post-it notes allowed the team to see recurring themes and assess the importance of each point — this can be difficult to achieve in traditional workshops, where repetition is often avoided. For instance, over 16 post-its underscored the need for quantitative data to measure outcomes, cost-effectiveness, and the catalytic impact of FAO’s work in Uganda.
⦿ Holistic understanding. The visual nature of Evaluvision allowed participants to see how each piece of the puzzle fit into the broader context, fostering a holistic view of the evaluation elements. One participant noted “Visualization really helps in structuring thoughts in the minds of participants and clustering their input overall”. Participants identified gaps in the ‘journey to the SDG goals’, such as the need to address food safety, transboundary issues, and the lack of concrete environmental outcomes. As one team member observed, the workshop “helped people to see the pathways and promoted higher-level learning”.
⦿ Potential long-term impact. Although the long-term outcomes are yet to be seen, the workshop made participants feel actively involved and heard. This is likely to increase their ownership and use of the evaluation findings. The final visual image also serves as a lasting mnemonic and motivation for action.

Scaling the use of Evaluvision for greater impact
The team’s experience suggests that this approach can add significant value to the evaluation process by promoting reflection and learning, generating useful feedback, and building ownership of the findings. It is particularly effective for focus group discussions and workshops during the evaluation mission, providing real-time feedback that can still shape and influence outcomes. Opportunities for enhancing participation were identified, such as starting with participants sharing their goals for the workshop and incorporating tools like online voting or small group discussions to better manage larger groups. While graphic facilitation works best with smaller groups, the methodology is flexible and can be adapted to work with different group sizes, participant types and meeting goals.
More info
https://www.evaluvision.org/
To find a graphic facilitator near you, contact the International Forum of Visual Practitioners https://ifvp.org/
If you want to share your experience, reach out to [email protected]
Photos: Harriet Matsaert/Eric Wakabi
