Statistics Division (ESS)
The FAO Statistics Division (ESS) serves as the foremost authoritative source of reliable data, standards and methods on food and agriculture – as per Article I of the FAO Constitution – contributing evidence-based information for a world free from hunger.
About FAO's statistical system
The Statistics Division (ESS), together with statistics units embedded in technical departments and statisticians deployed in decentralized offices, constitute FAO’s statistical system. ESS Director, who also plays the role of FAO's Chief Statistician, is responsible for the overall coordination and governance of FAO’s work on data and statistics.
Mandate
- Collect, analyze and disseminate agrifood systems data from member countries, generating statistics and accompanying briefs in FAOSTAT, RuLIS and other relevant platforms.
- Work directly with countries to develop national statistical strategies, strengthen institutional and technical capacities and improve statistical systems.
- Develop and promote international food and agricultural statistical standards, as well as methods and tools for collecting, analyzing and disseminating data.
Additionally, in its function as Secretariat of the Office of the Chief Statistician:
- Ensure stronger governance of FAO's statistical system.
- Foster consistency of FAO's Statistical programme with the Strategic Framework.
- Ensure statistical excellence through the implementation of statistical standards and quality assurance mechanisms.
- Position FAO's presence in statistical discussions at global level.
Areas of work
Data Generation and Capacity Building
Manages the decennial World Programme for the Census of Agriculture and provides standards guidelines on methods, concepts and definitions, as well as technical assistance and capacity building on census planning and implementation.
Contact: Mr. Jairo Castaño
Offers technical assistance and capacity development to countries through two flagship initiatives: the 50x2030 Initiative to Close the Agricultural Data Gap and the Global Strategy to Improve Agricultural and Rural Statistics (GSARS). These initiatives aim to bolster agricultural statistical systems, facilitating the regular production and dissemination of robust and comprehensive agricultural data for supporting evidence-based policymaking in the agricultural sector.
Contacts: Mr. Christophe Duhamel (Project Manager, 50x2030 Initiative) and Ms. Neli Georgieva, Project Manager (GSARS)
Collects, analyzes and disseminates global food and agricultural data covering crops and livestock production and yields, trade at bilateral detail, and food balances including components such as stocks and losses.
Contact: Mr. Piero Conforti (a.i.)
Collects, analyzes and disseminates essential global food and agricultural data by country, supported by development of relevant methods and standards, covering agri-environment domains relevant to inputs, land and sustainability, including: fertilizers, pesticides, land use and land cover, climate change. Houses focal points for SDG indicator 2.4.1 (“Proportion of agricultural area under productive and sustainable agriculture”).
Contact: Mr. Francesco Tubiello
Collects, analyzes and disseminates global food security statistics. Develops new methods to generate food security and nutrition statistics and promotes the adoption of internationally agreed ones. Provides technical and capacity development support to member countries. Houses focal points for SDG indicators 2.1.1 (“Prevalence of undernourishment”) and 2.1.2 (“Prevalence of moderate or severe food insecurity in the population, based on the Food Insecurity Experience Scale”.
Contact: Mr. Carlo Cafiero
Collects, analyzes and disseminates statistics related to agricultural investments, prices, public expenditure; aid flows to agriculture; sectoral macro indicators. Produces and disseminates indicators of rural livelihoods. Works on methodologies and data on damage and loss from extreme events in agriculture. Houses focal points for SDG indicators 2.a.1 ("Public Investment in agriculture"), 2.3.1 ("Productivity of small-scale food producers"), 2.3.2 ("Income of small-scale food producer") and 5.a.1 ("Women’s ownership of agricultural land").
Contact: Ms. Verónica Boero
Data and Statistical Governance
Supports the governance and coordination of FAO’s data and statistical activities, both within FAO and within the broader international data and statistical community. Oversees the planning, monitoring and reporting on FAO data and statistical programme of work. Coordinates FAO’s role as custodian agency for 21 SDG indicators. Acts as focal points for any queries on intellectual property matters concerning FAO databases.
Contact: Ms. Valerie Bizier
Reviews and ensures adherence to the FAO Statistics and Data Quality Assurance Framework. Develops, promotes and supports the implementation of corporate data and statistical standards. Monitors and assesses the quality of FAO key statistical and data products. Performs users’ consultations. Leads technical and capacity development activities on data quality assurance. Contributes to improve the quality of food and agriculture data and statistics at national level.
Contact: Ms. Valerie Bizier (a.i.)
Disseminates statistics and visualizations related to FAO’s areas of work through the FAO statistical dissemination platforms and statistical publications. Increases visibility and provides user engagement on the content, collections, and utilization of FAO’s statistical outputs and data products. Ensures better coordination and exchange of information among stakeholders. Modernizes statistical dissemination processes and platforms.
Contact: Ms. Nancy Chin
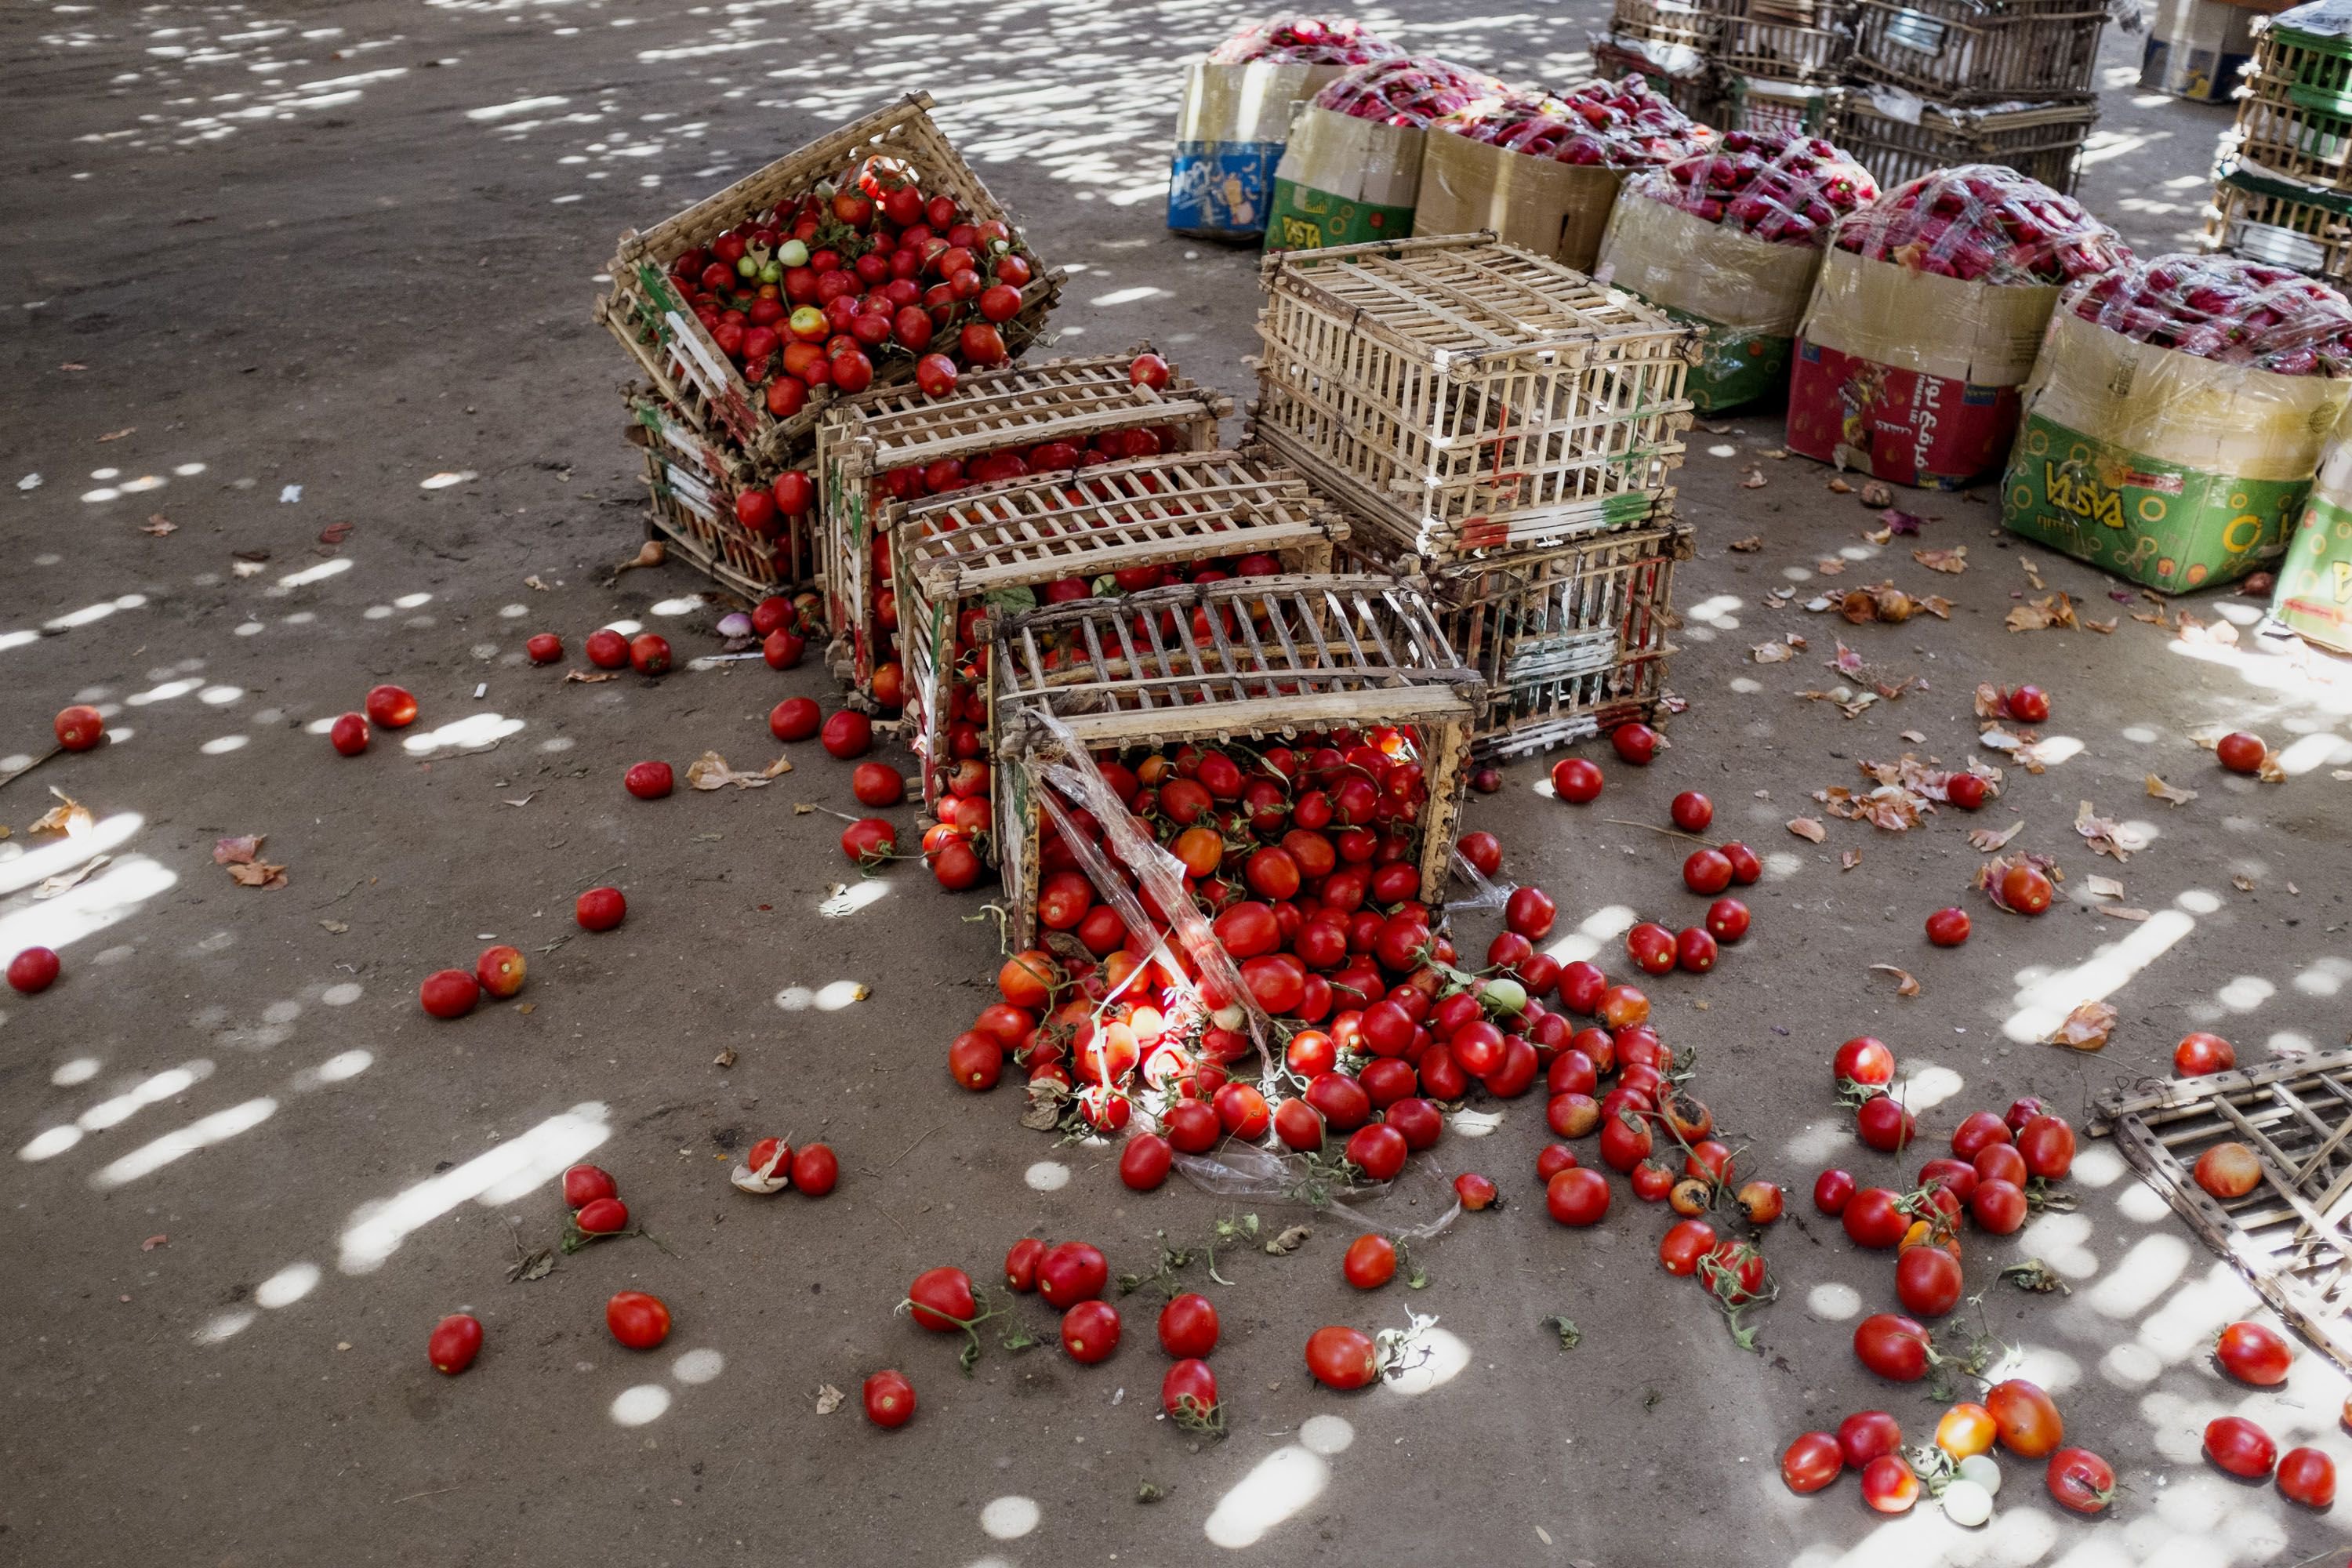
Develops new methods based on data science that use big data and non-conventional data sources to fill data gaps and produce innovative real-time analytics. Leverages earth observation data to produce official agricultural statistics. Compiles SDG sub-indicator 12.3.1.a to monitor food losses along the supply chain and support countries’ capacity development. Reviews, innovates and integrates FAO’s main statistical processes in the corporate statistical working system. Contributes to the implementation of FAO’s statistical standards and disseminates statistical classifications in an open link data environment.
Contact: Ms. Carola Fabi
In focus
Databases

.jpeg?sfvrsn=77341c74_11)
Main initiatives


Flagship and statistical reports


.png?sfvrsn=bb2d7aac_11)


.png?sfvrsn=bbc7fbcd_11)

Software resources and tools

Meetings and events
More about FAO Statistics
- FAO Statistics website
- Data collection
- Data dissemination
- Methods, standards and classifications
- Statistical capacity development
- FAO Statistics Resource Repository
External links
Contact
Chief Statistician and Director, Statistics Division (ESS)
Deputy Director (Data Generation and Capacity Building), Statistics Division (ESS)
Deputy Director (Data and Statistical Governance), Statistics Division (ESS)